This design showcases the same database from 2018 to 2020 about sustainable and ethical commitments of apparel companies gathered by “Fashion Revolution” in two different visualisation products, a series of illustrative graphics and a website prototype created in adobe XD. Each design product was thought to be for different audiences: expert decision makers and major apparel consumers.
This design showcases the same database in two different visualisation products, a series of illustrative graphics and a website prototype created in adobe XD. Each design product was thought to be for different audiences: expert decision makers and a major apparel consumers ranking from an age of 20 to 39 years old.
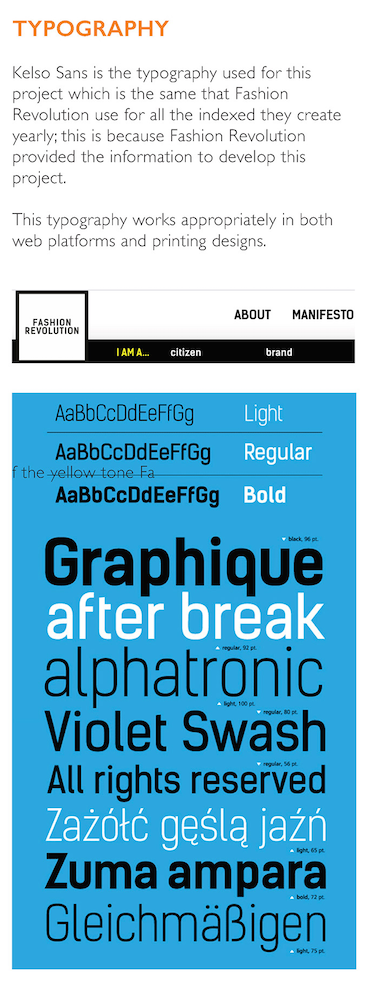
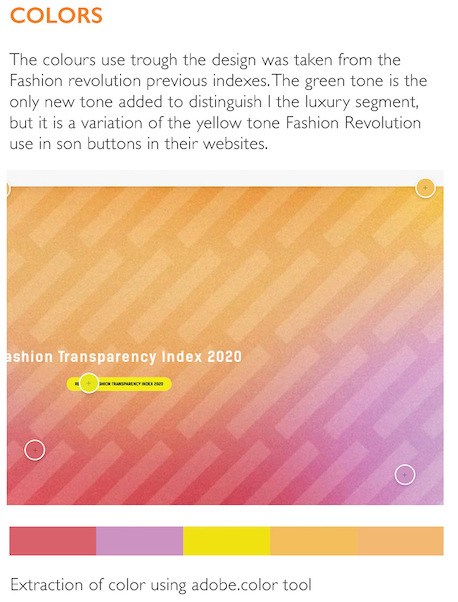
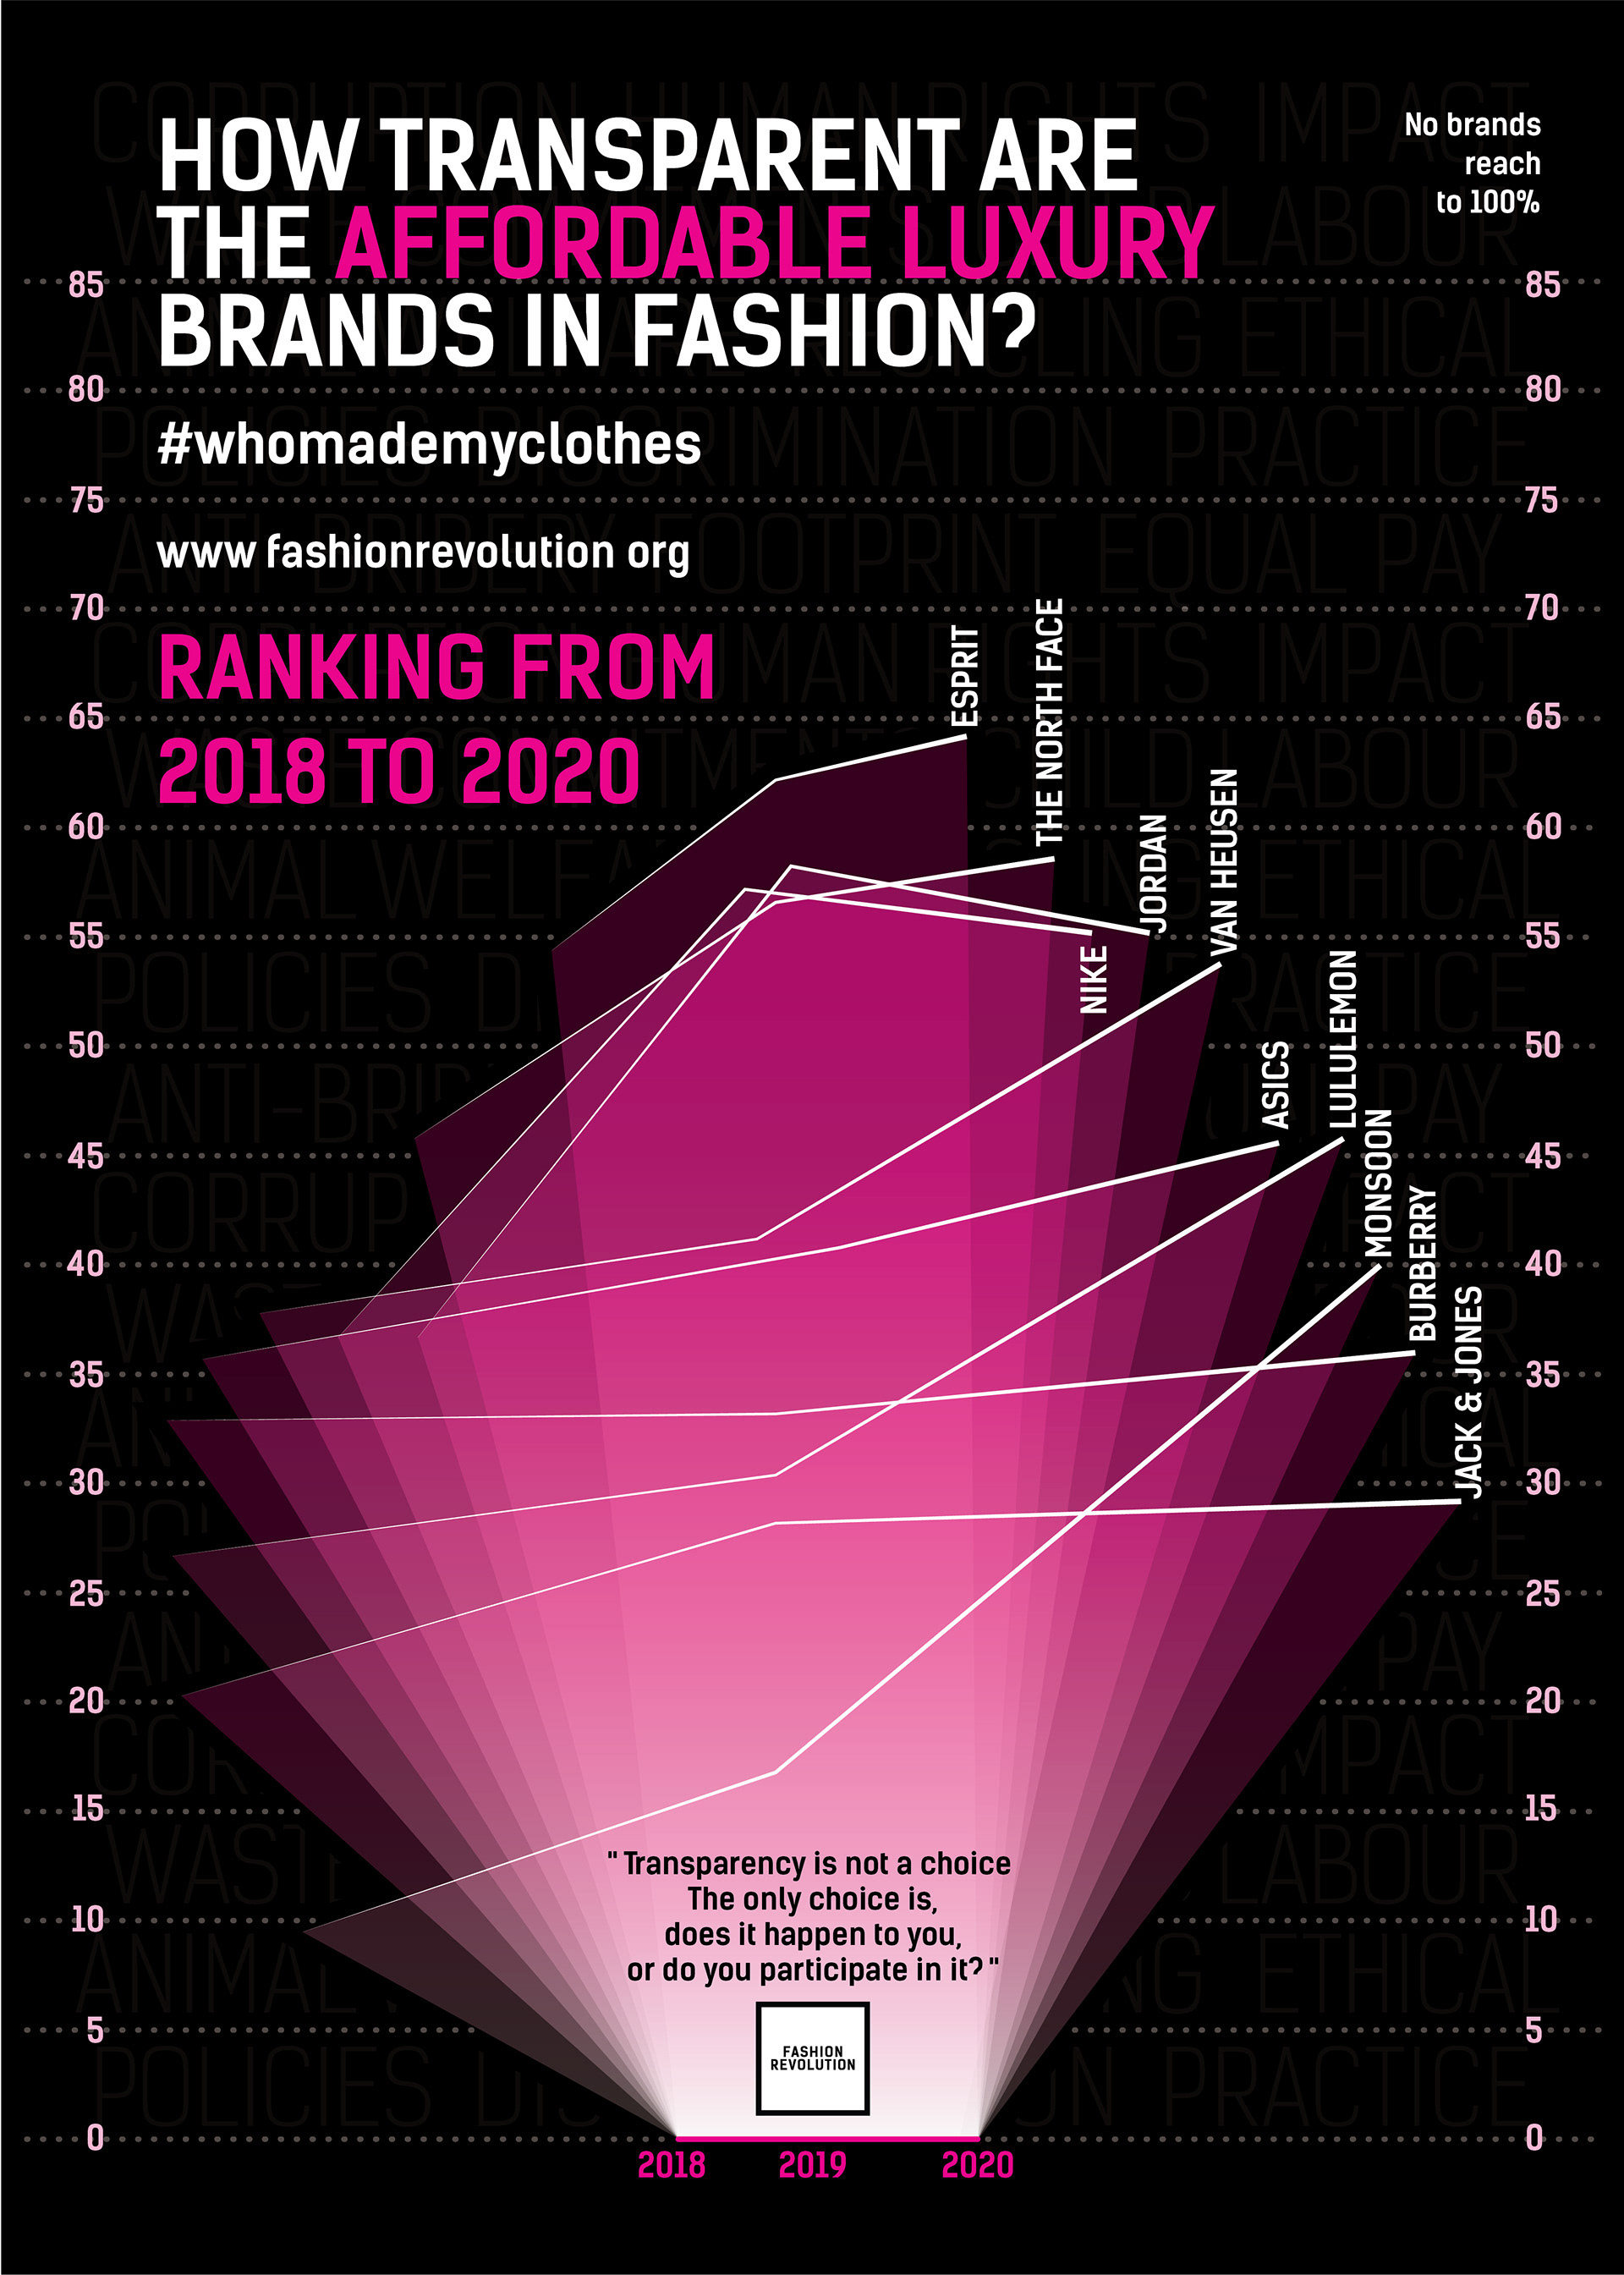
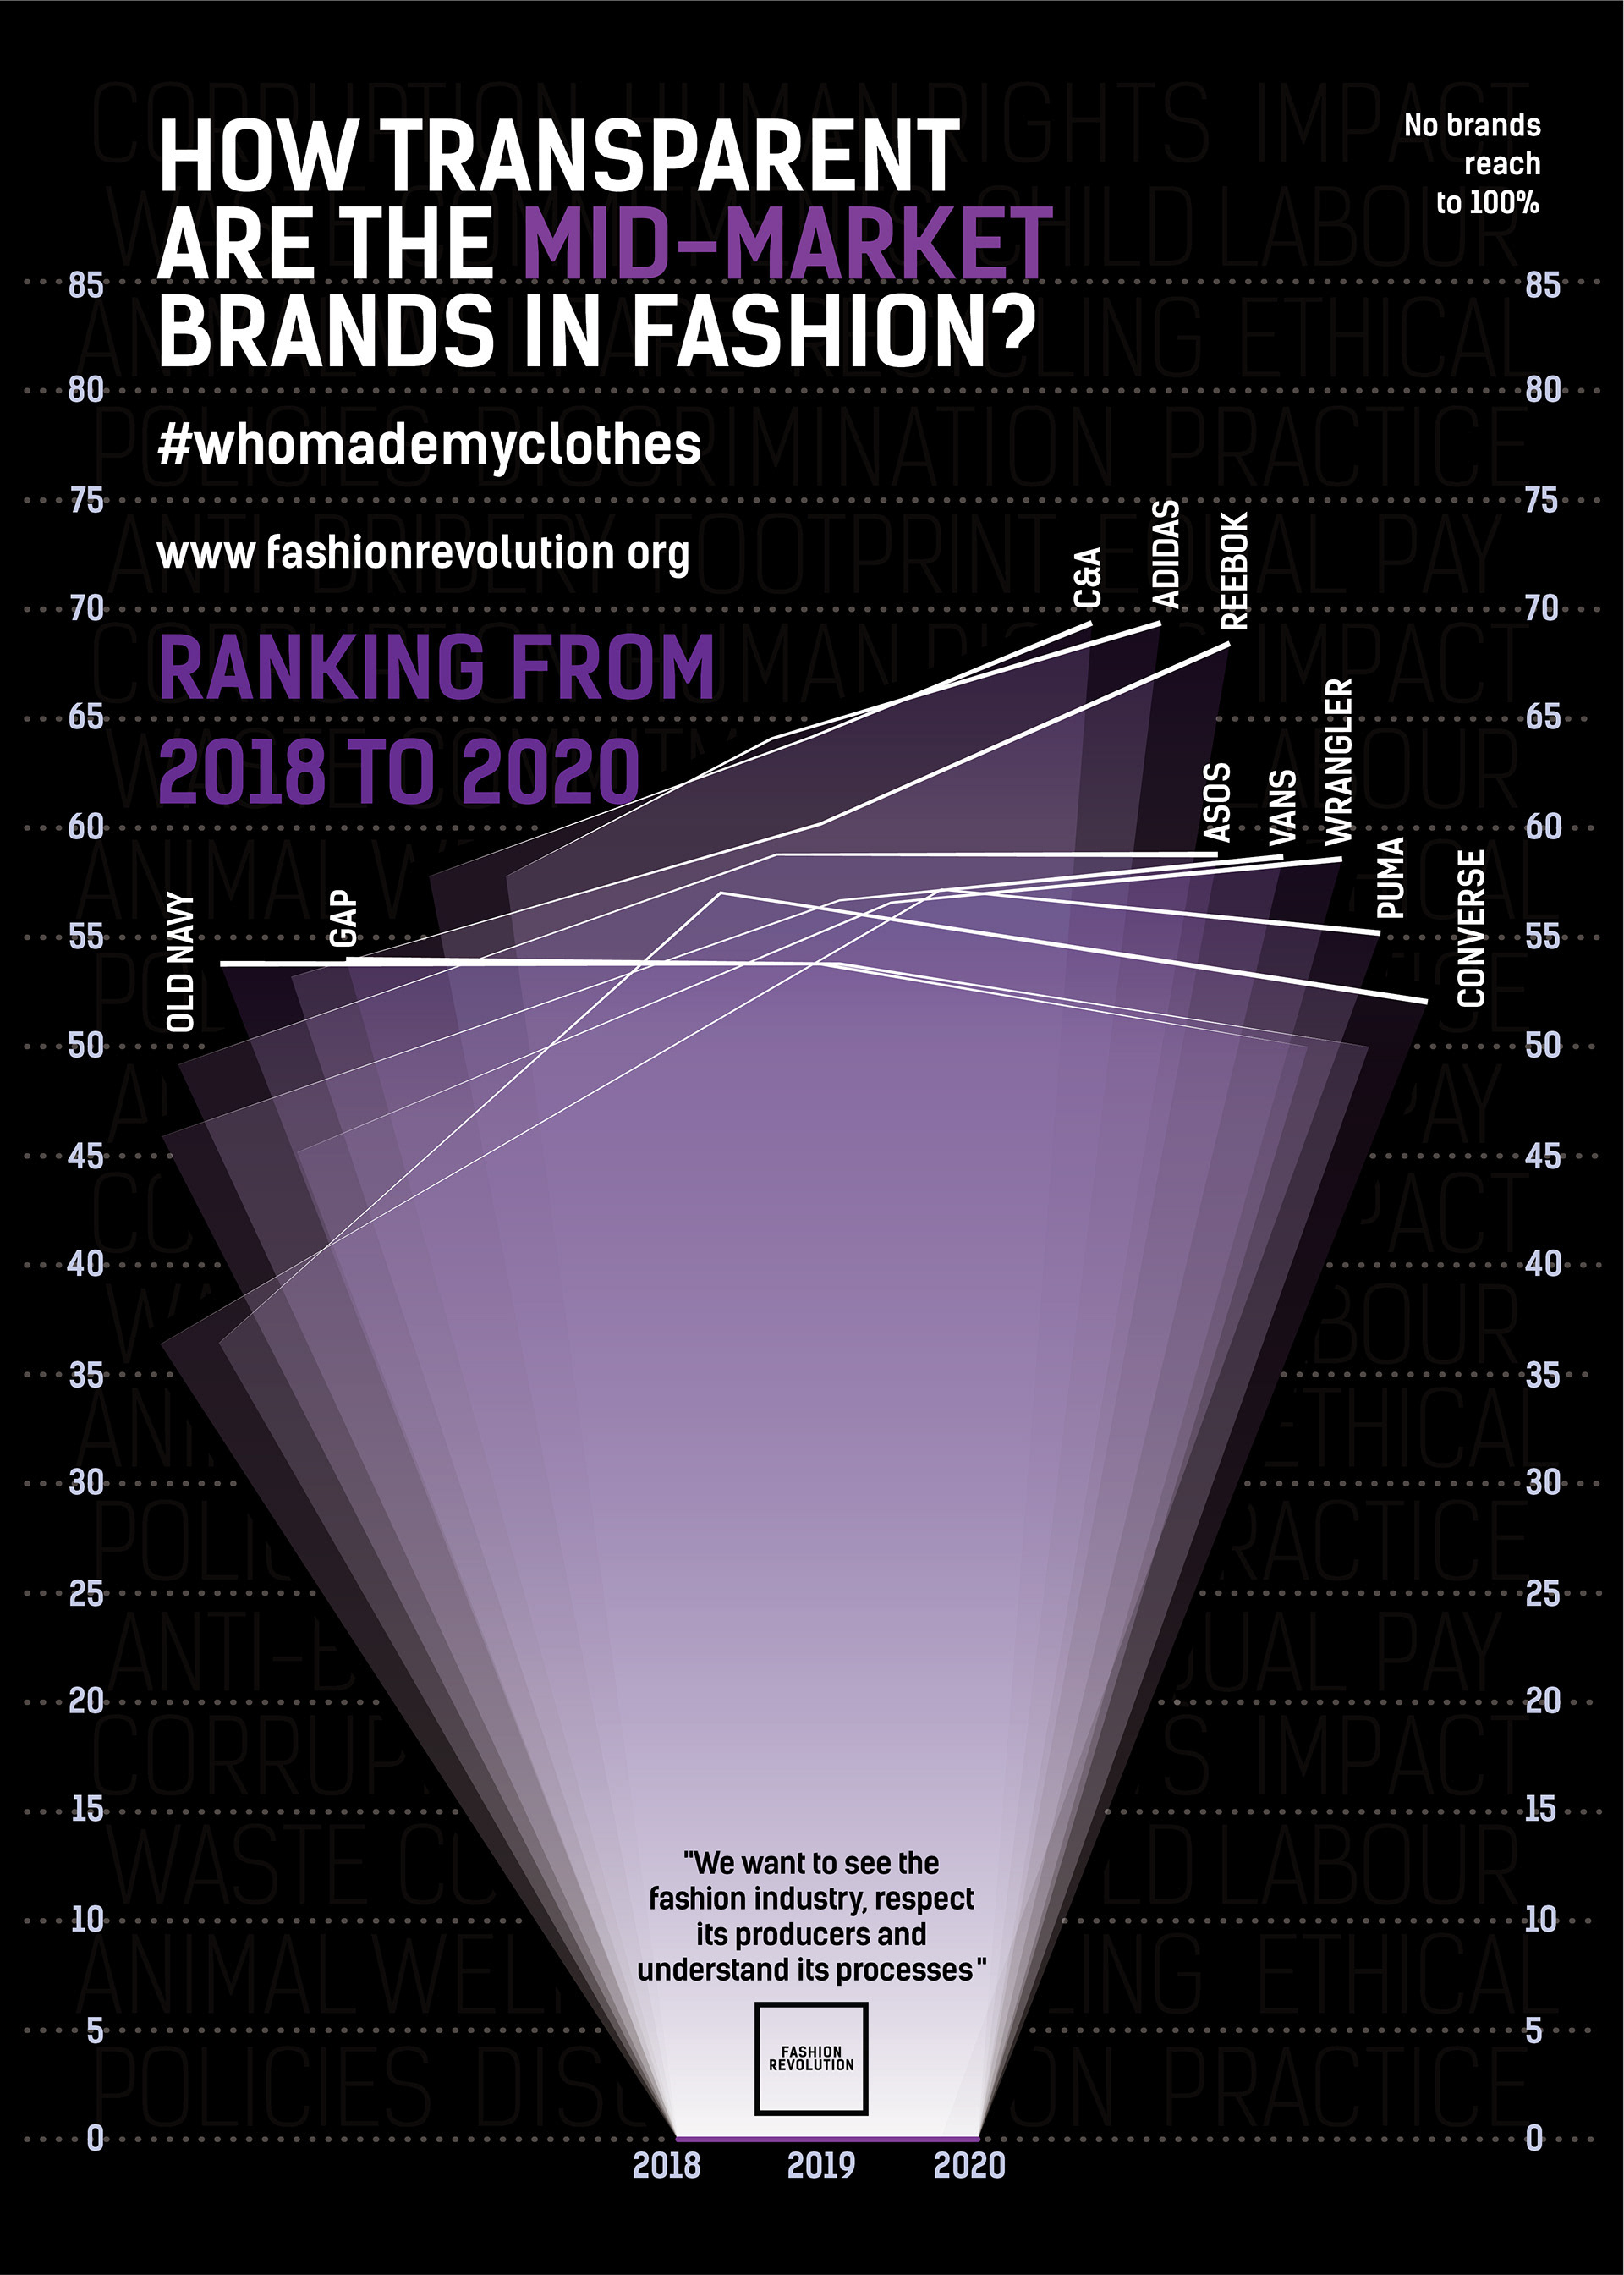
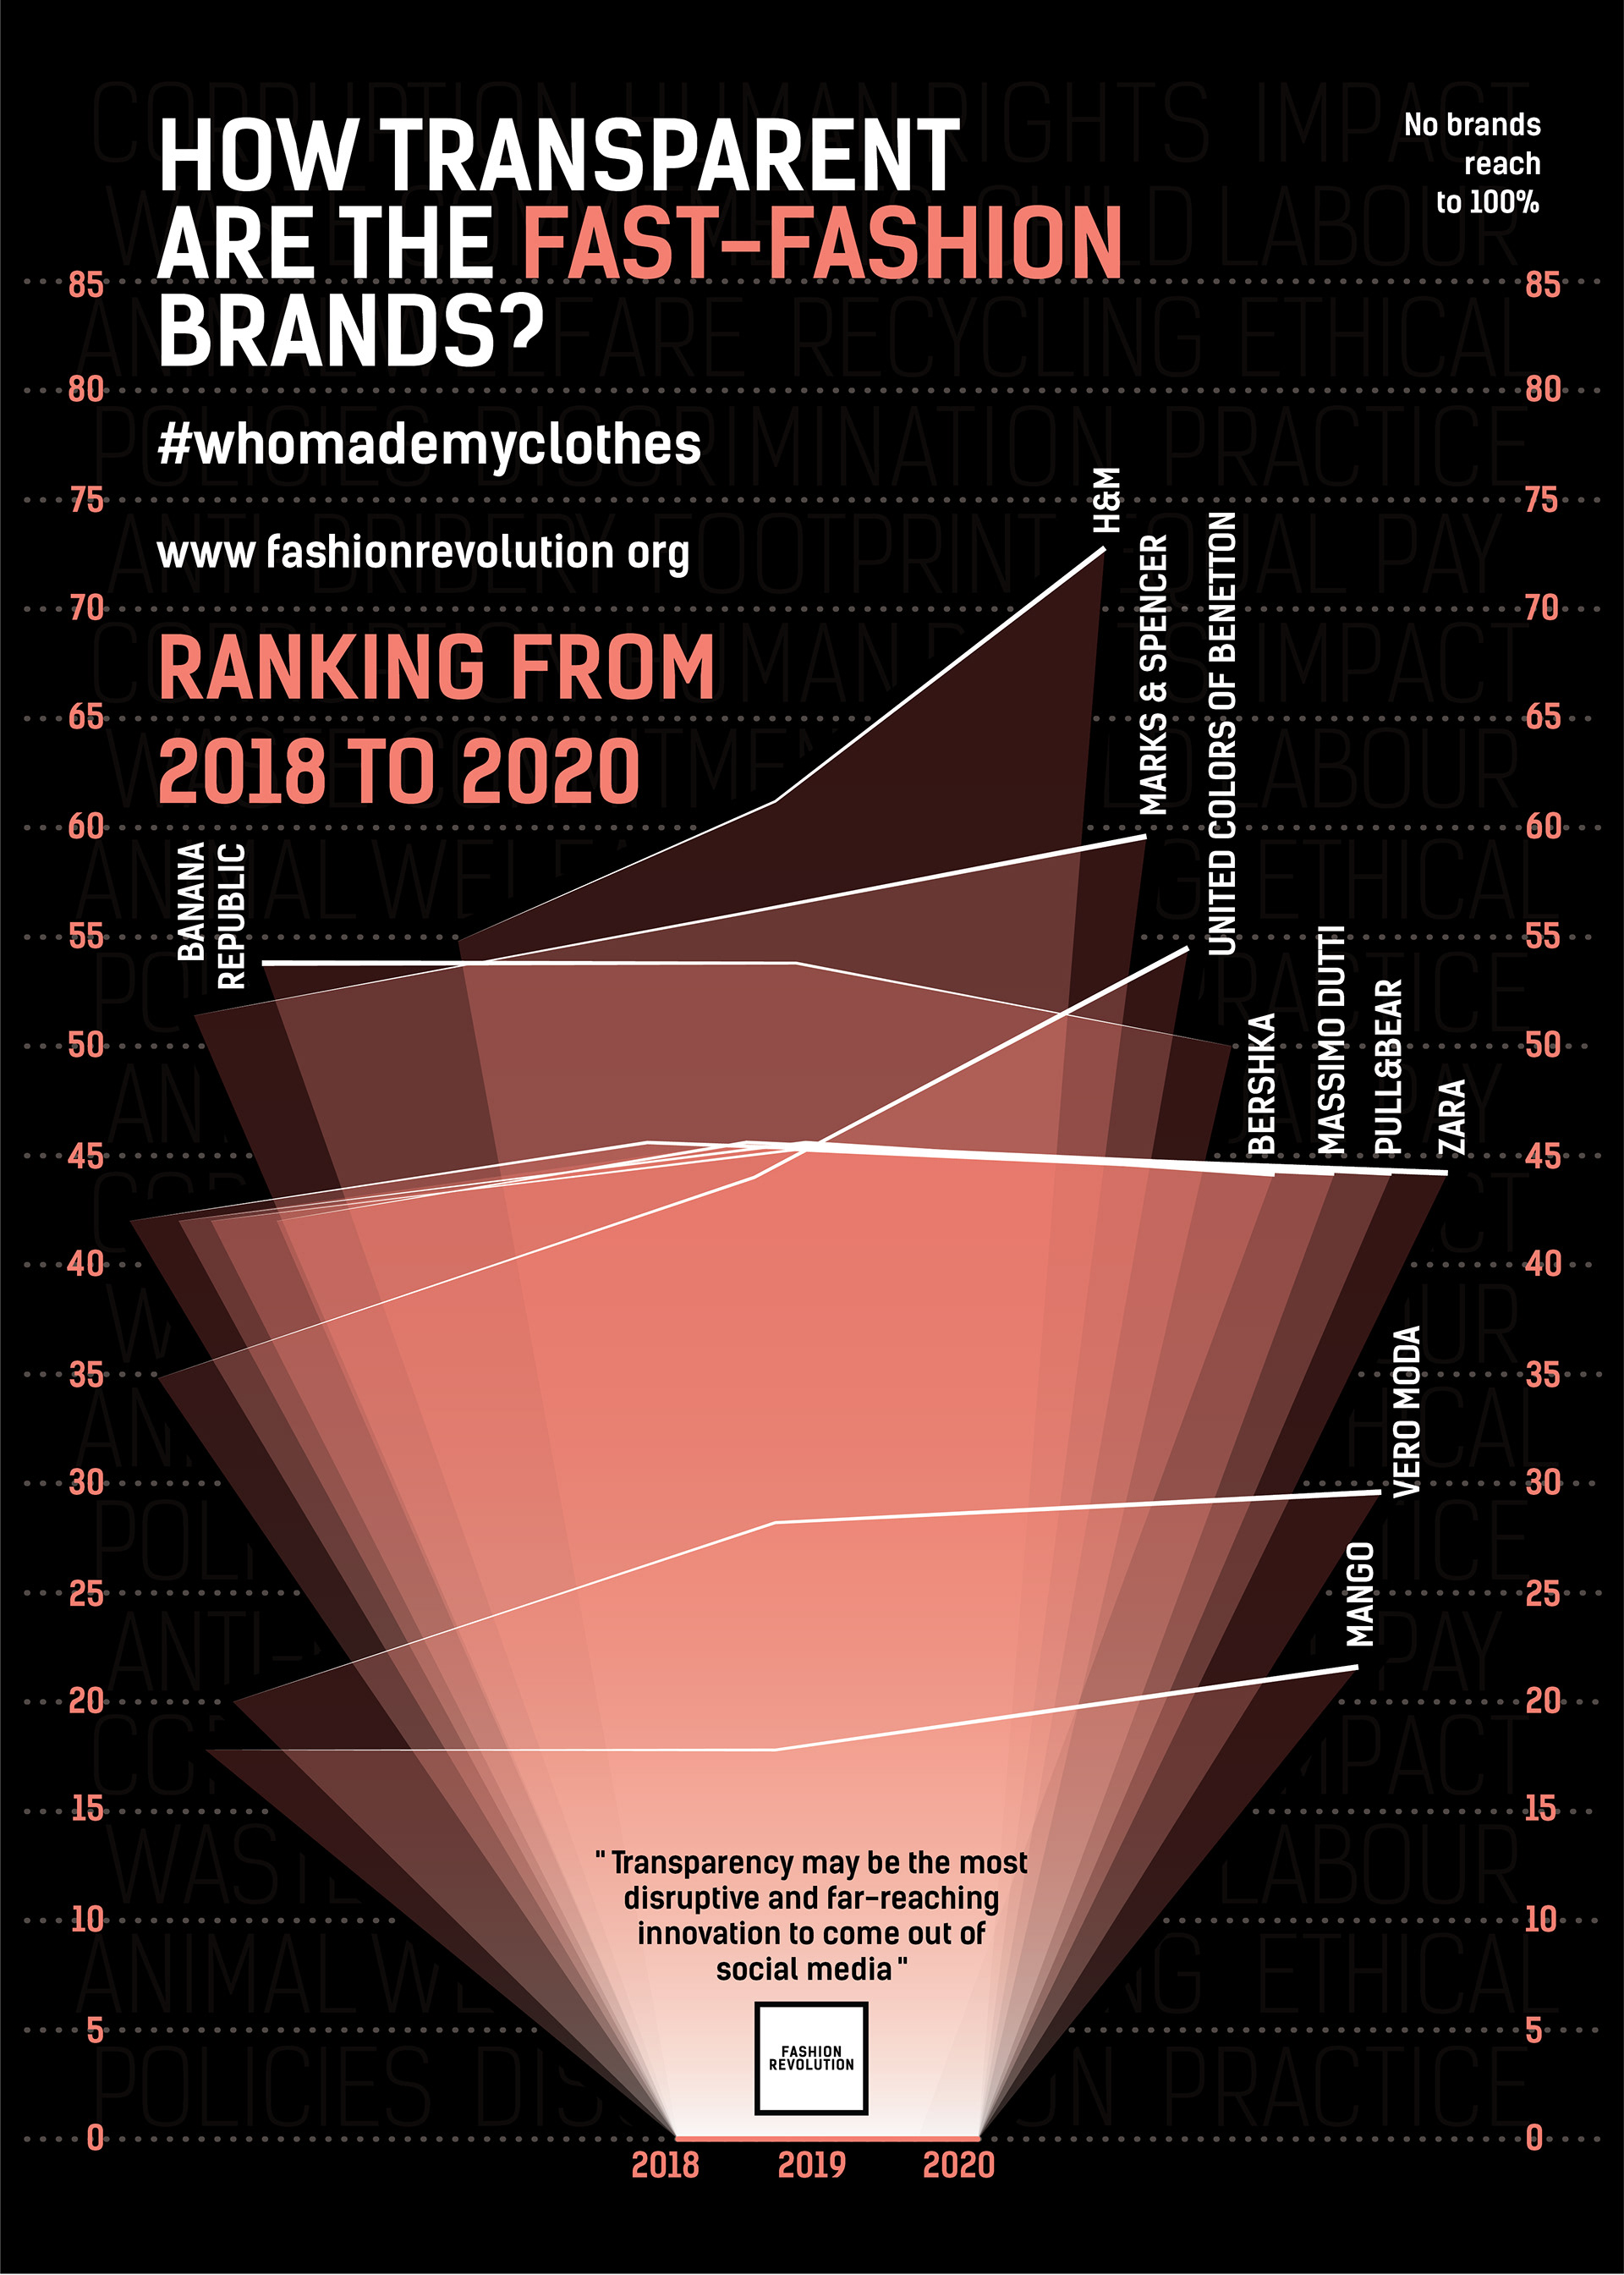
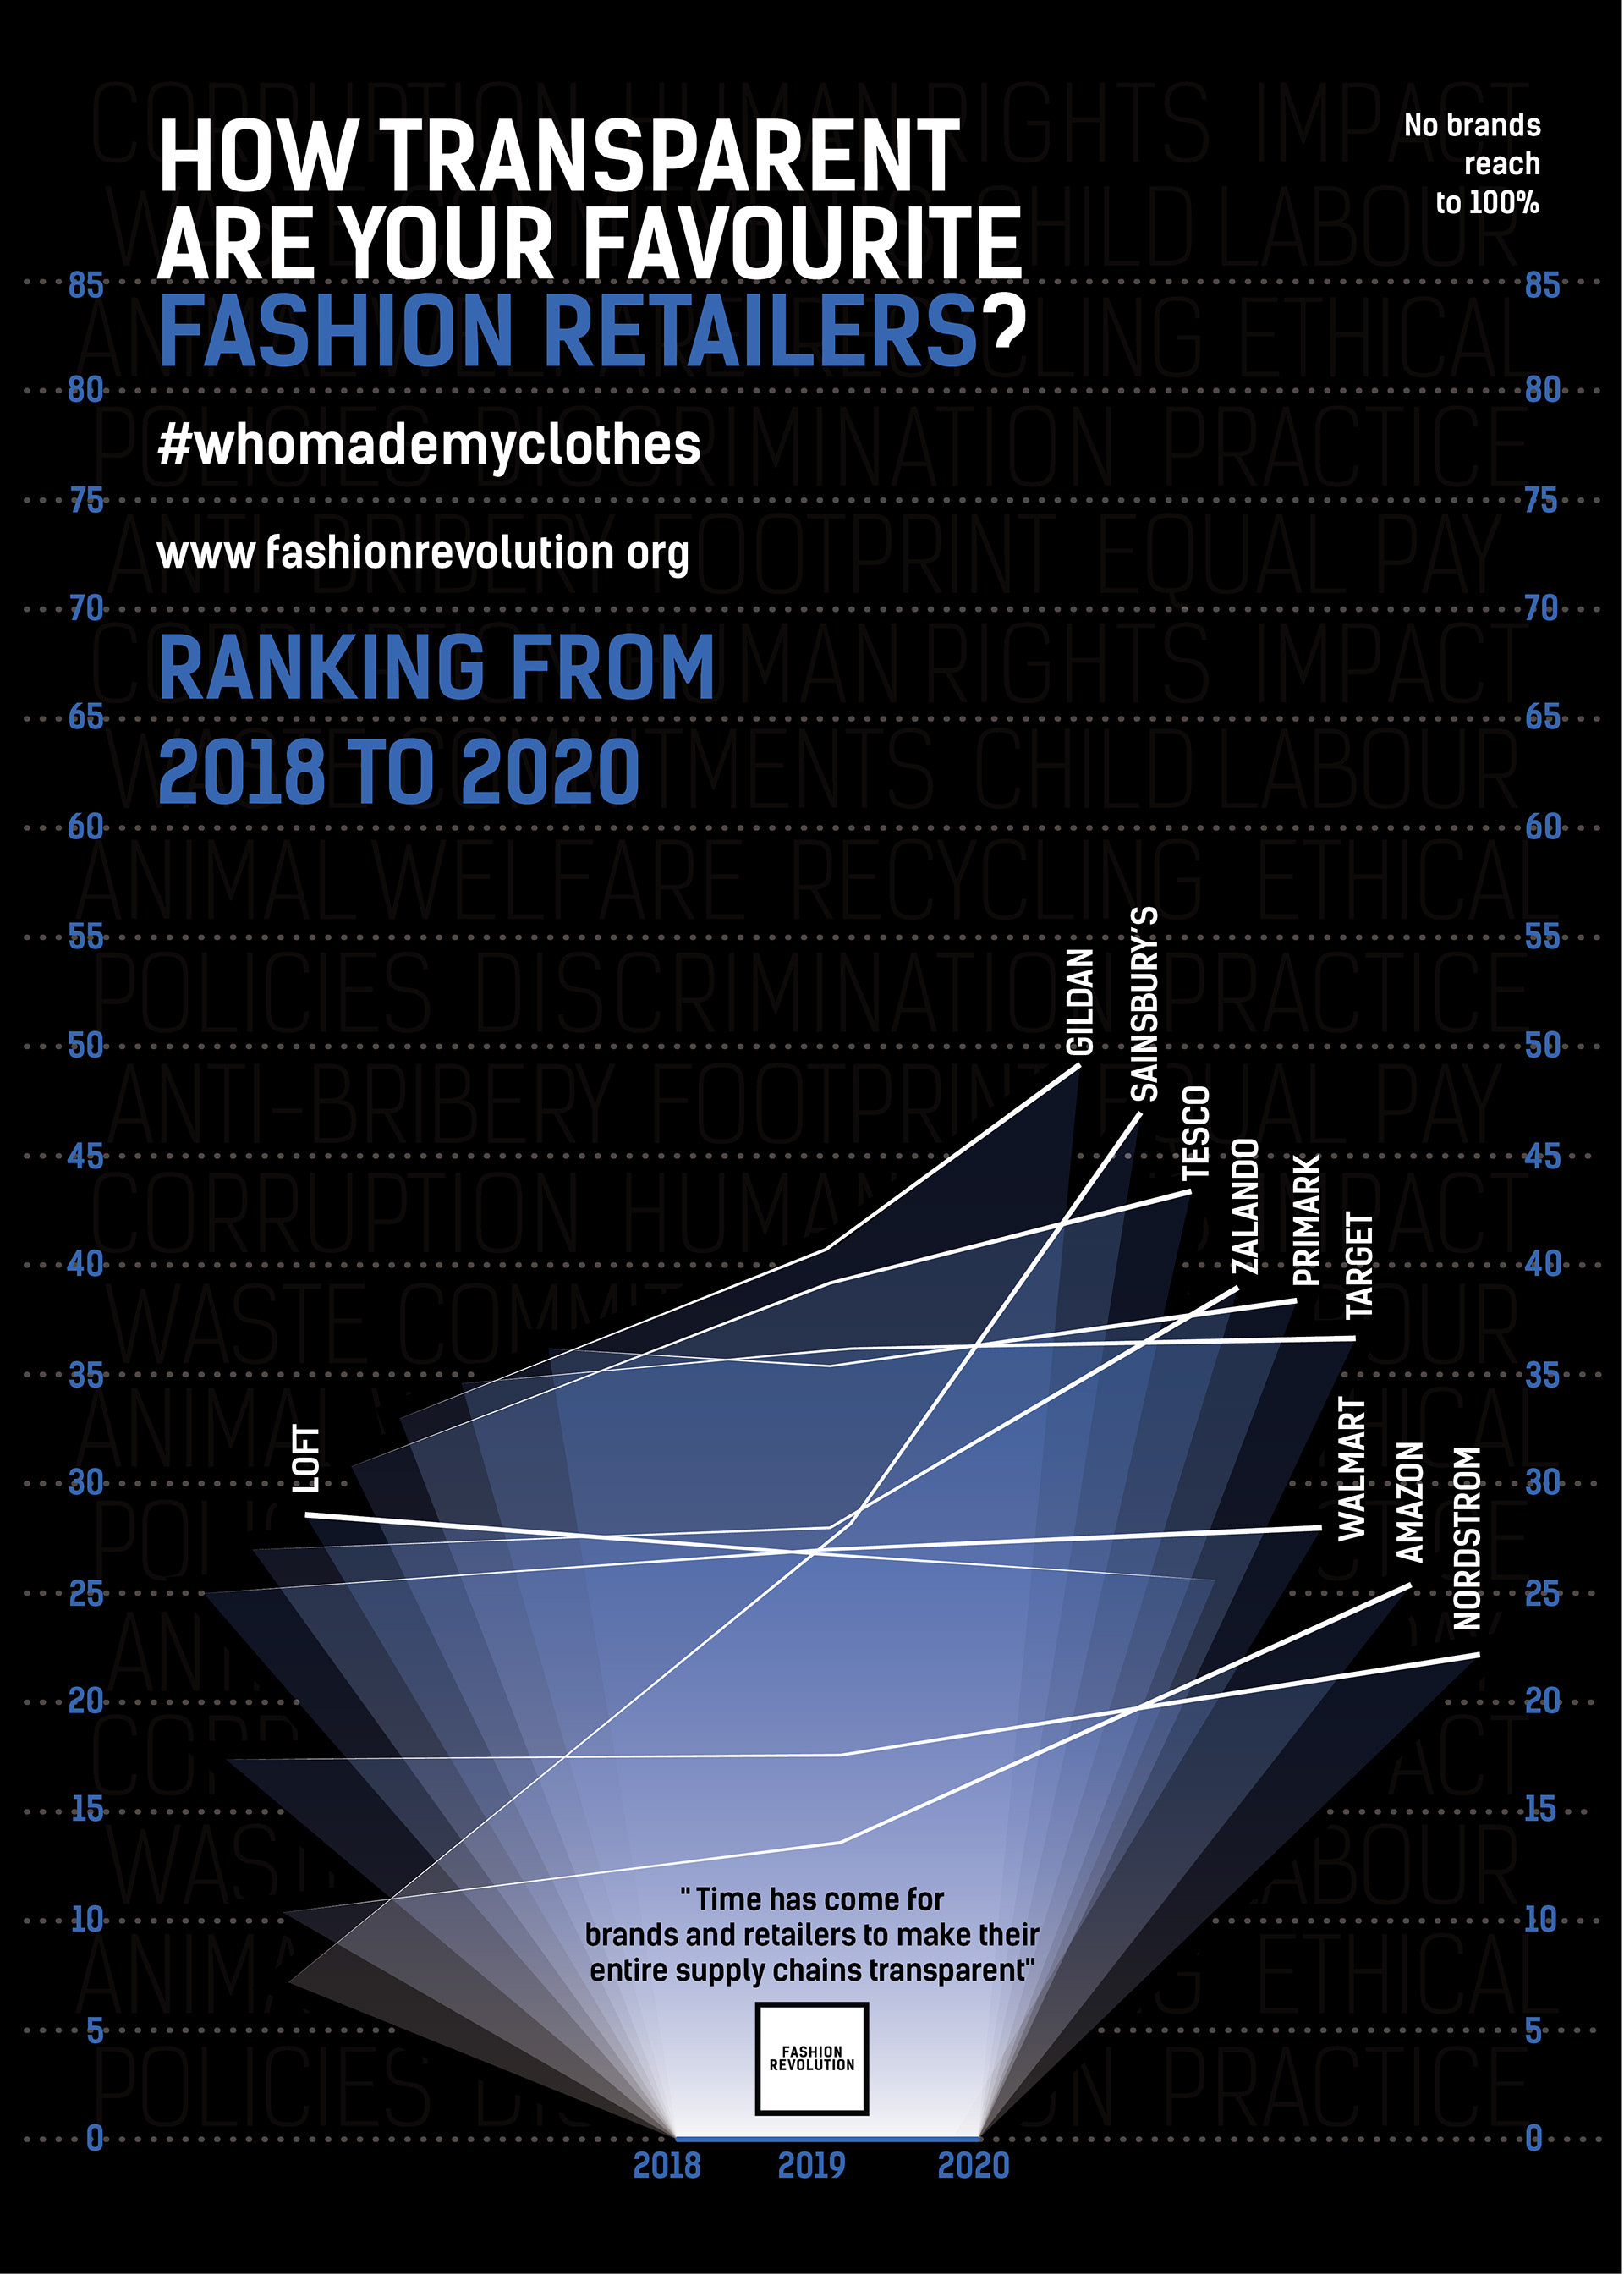
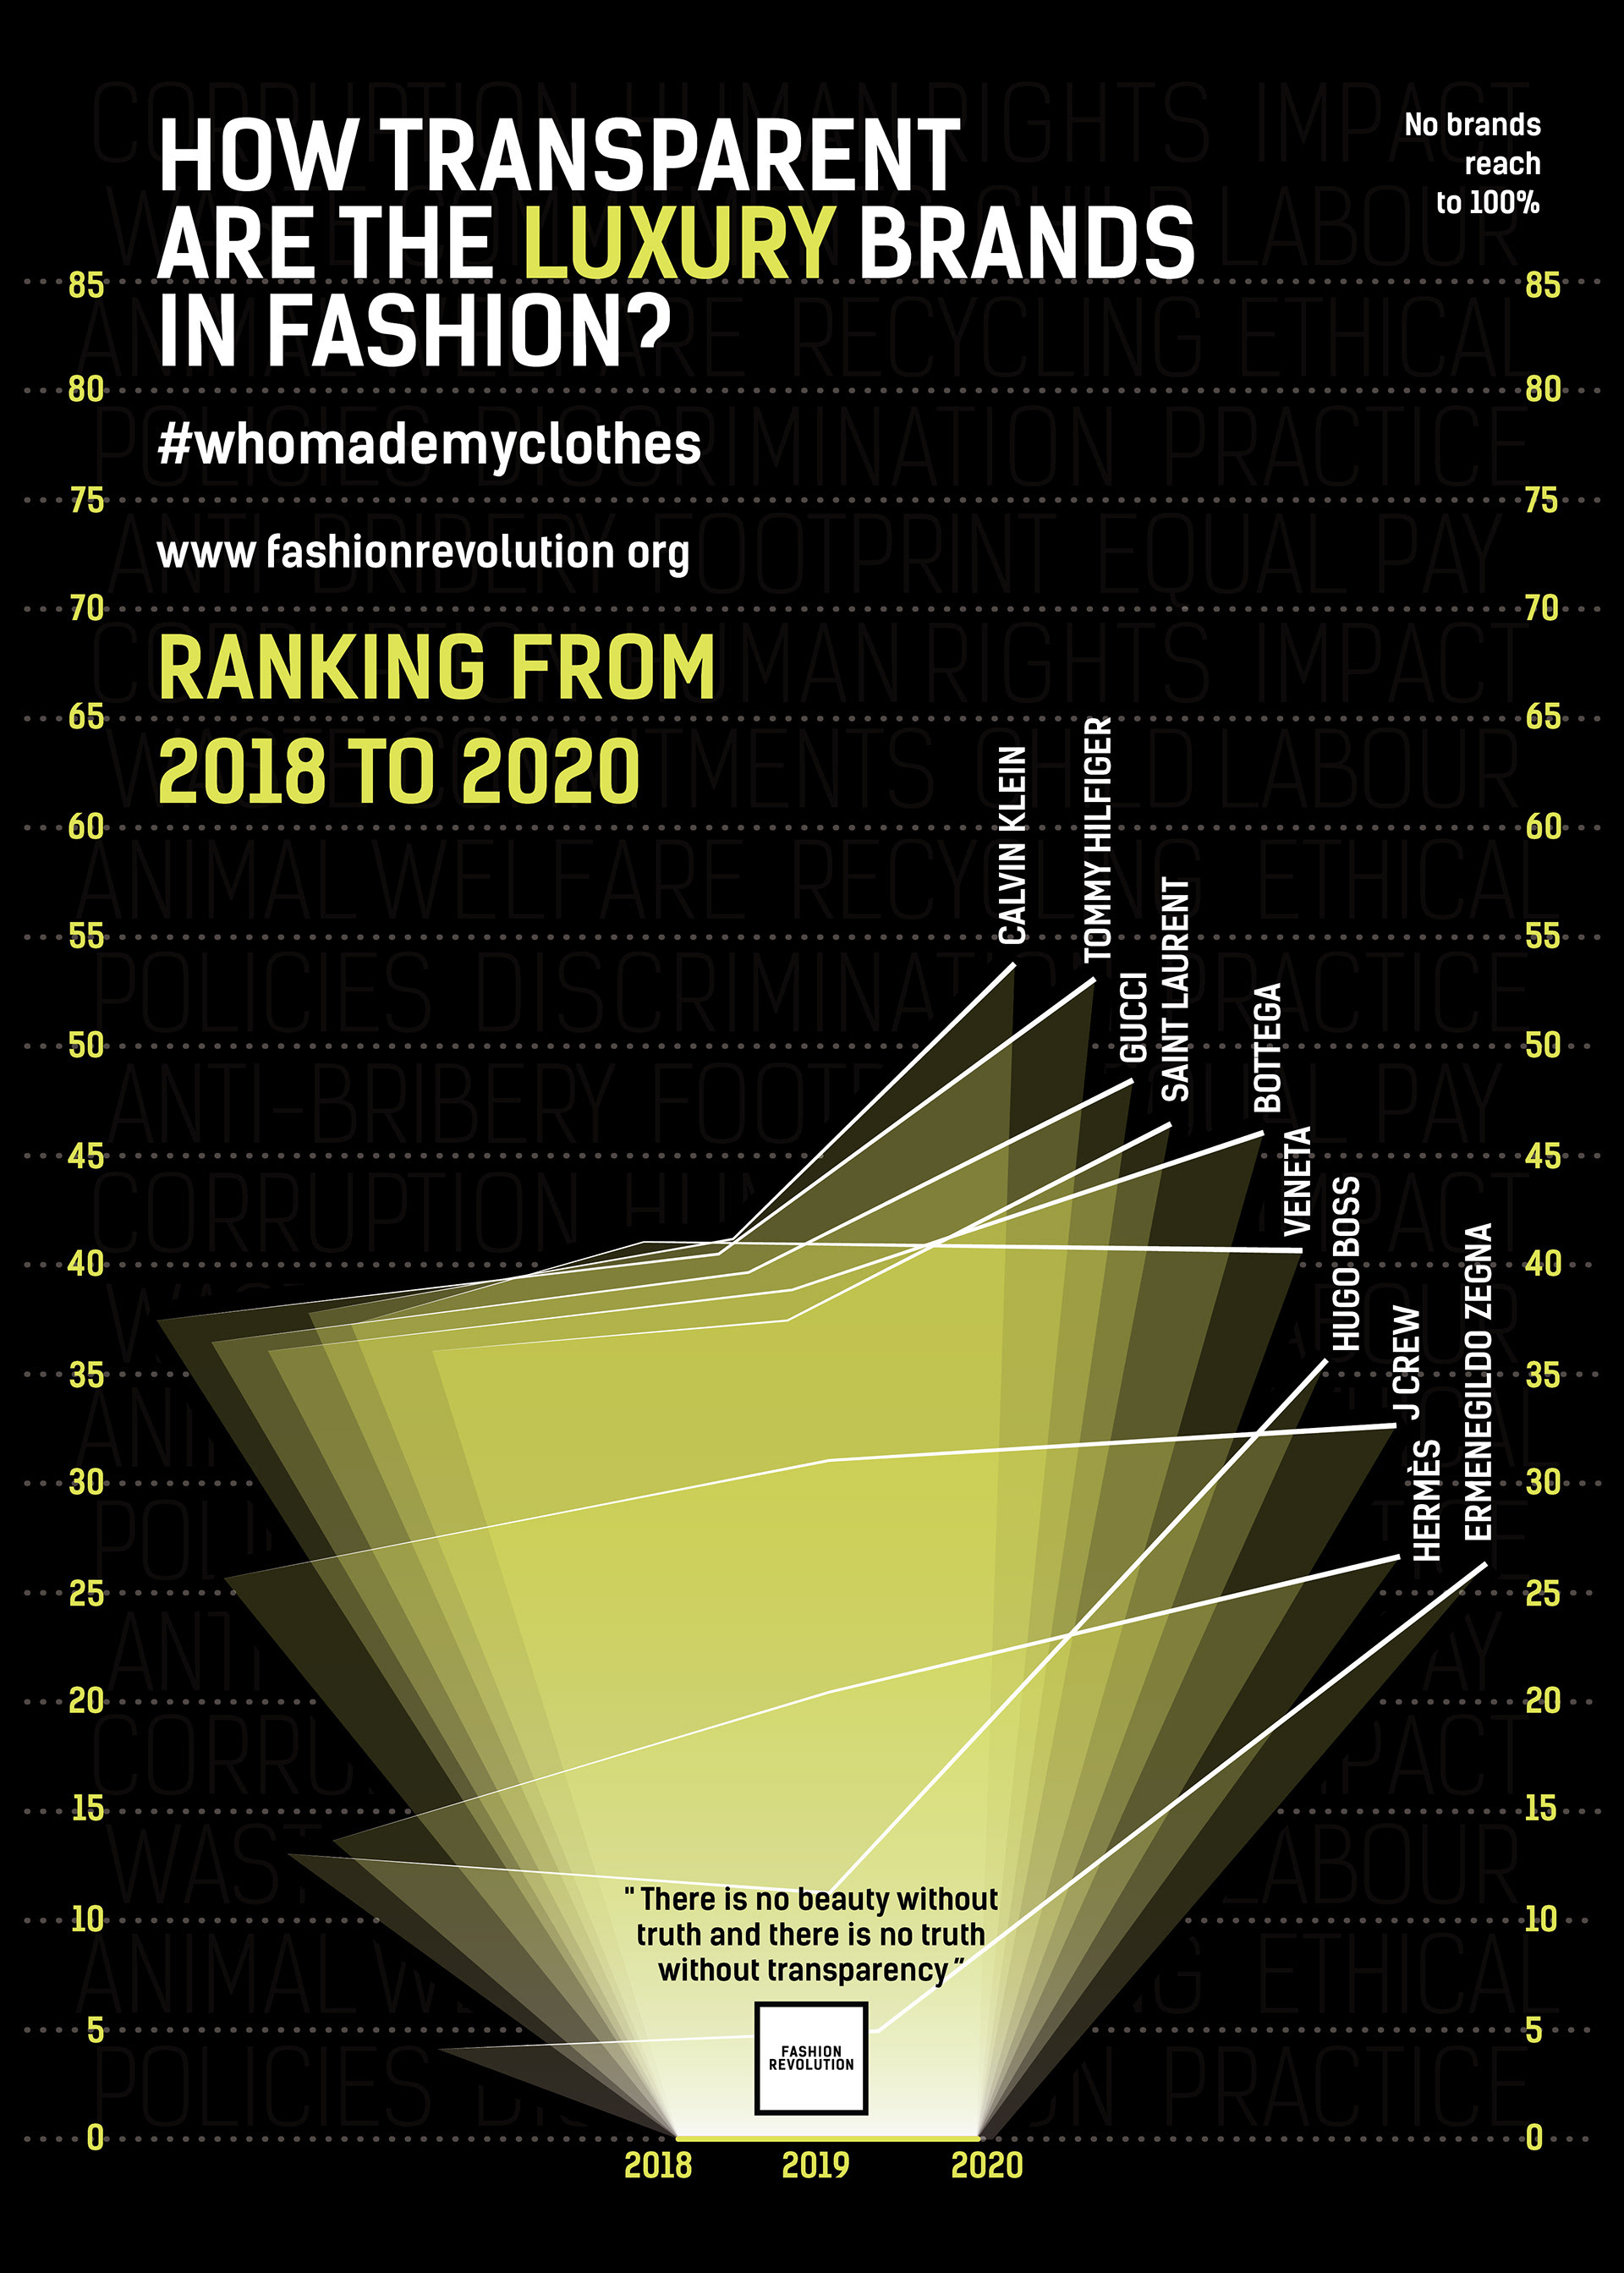
This designs uses information from 2018 to 2020 about the sustainable and ethical commitments of apparel companies that “Fashion Revolution” has gather and shown in an impact report called the fashion transparency Index.
Prototype
Static Graphics
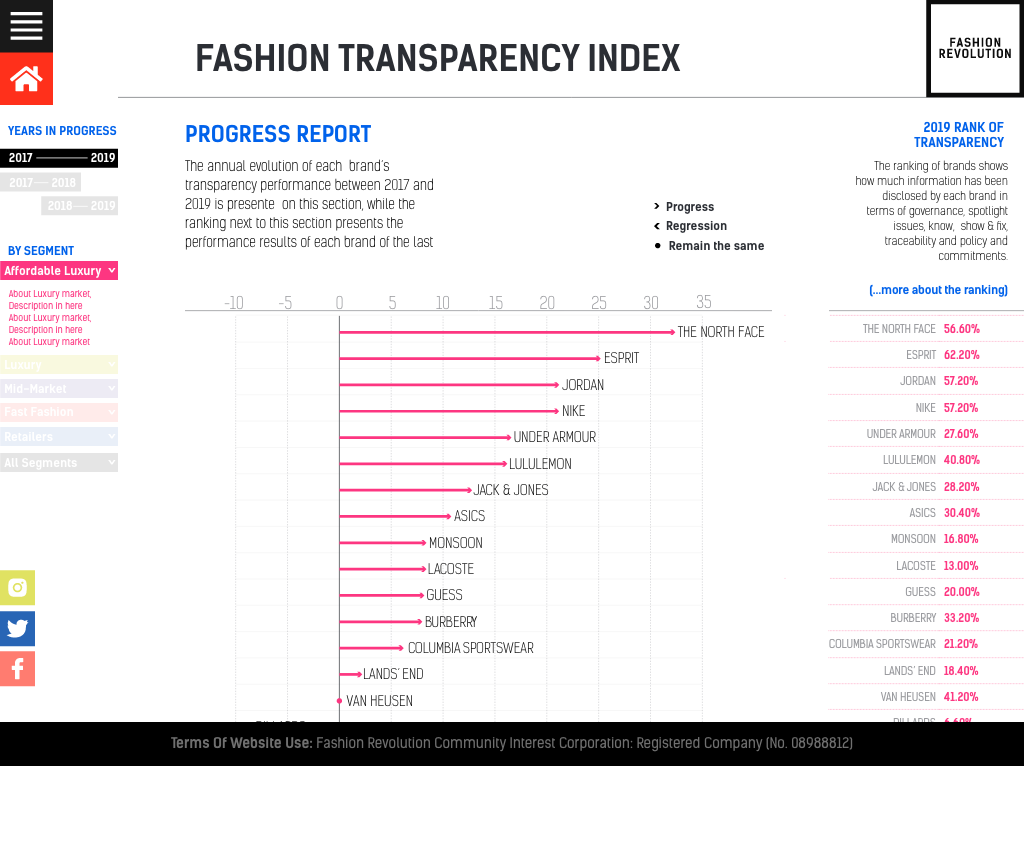
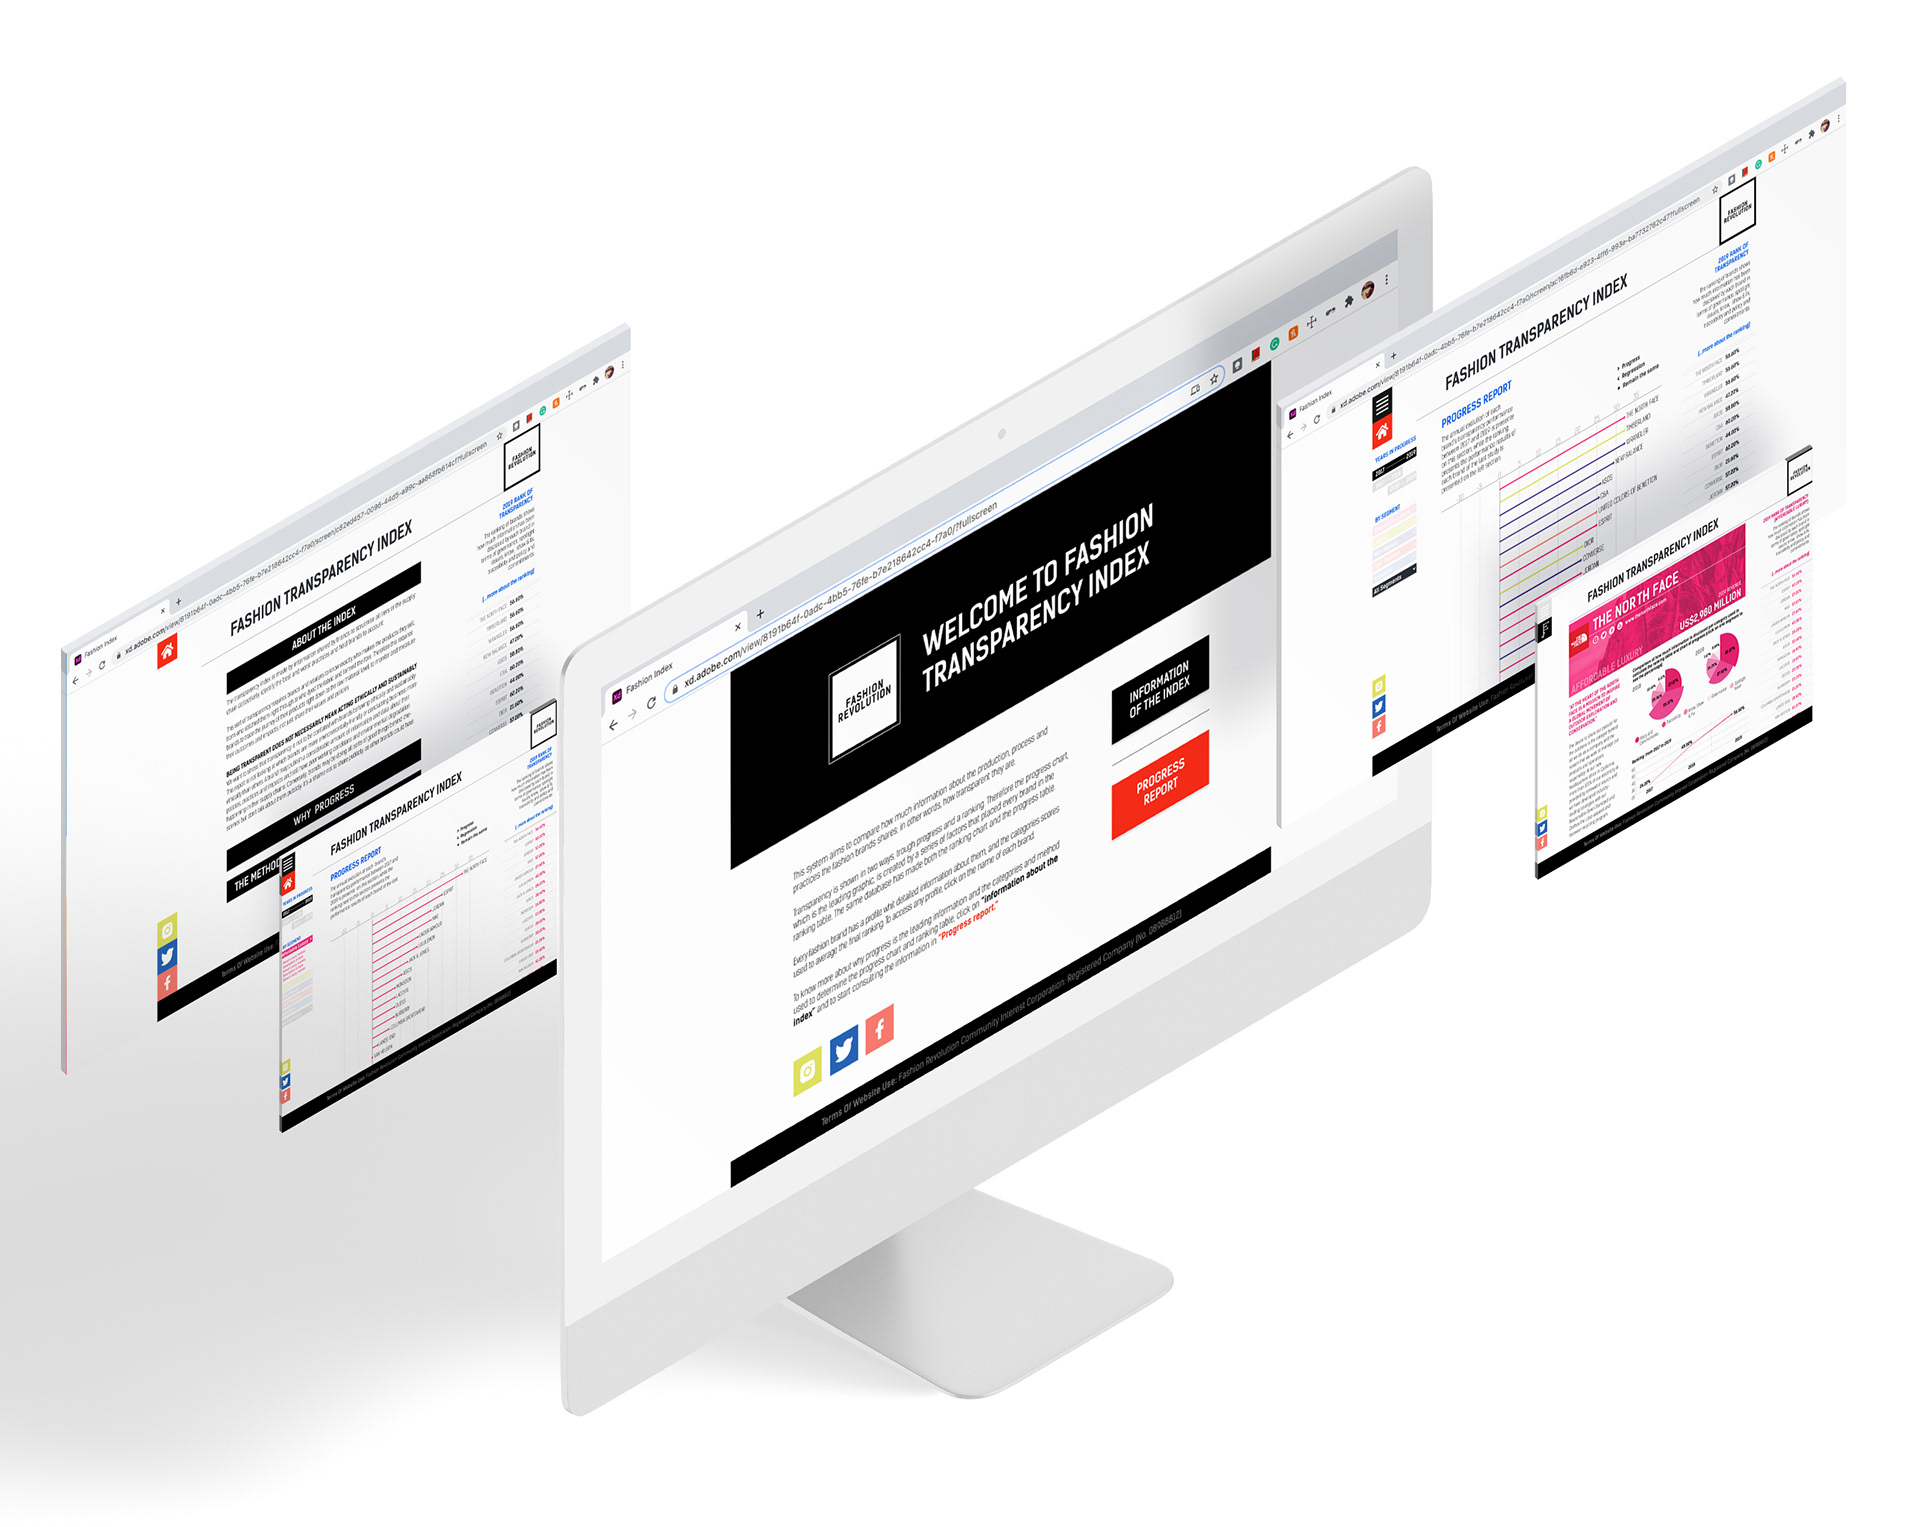
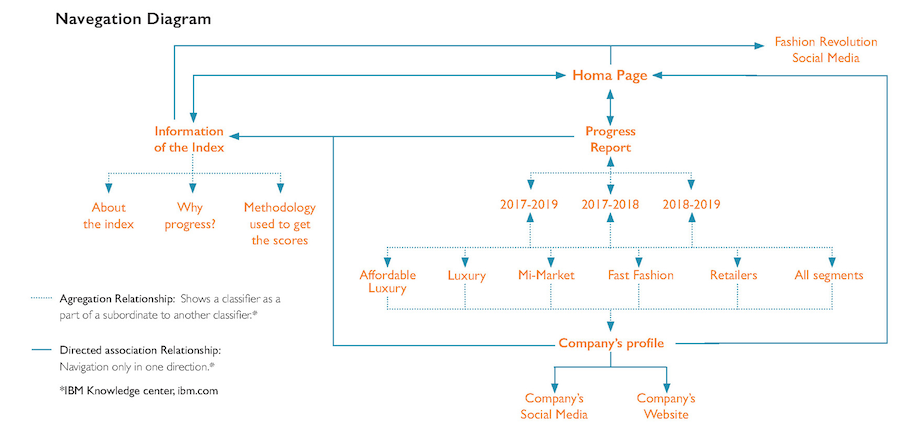
The website prototype is an interactive visualisation that enhances the idea of competition between brands. To achieve the aim’s website, the visualisation encompasses the research of the fashion companies from 2018 to 2020 and compares their progress during those years in different timelines and lineal charts. Within the charts, each company is thought to have a link to official document or website
(example H&M https://hmfoundation.com/) that supports their ethical and friendly environmental actions to advertise their achievements and encourage their participation in the fashion transparency index.
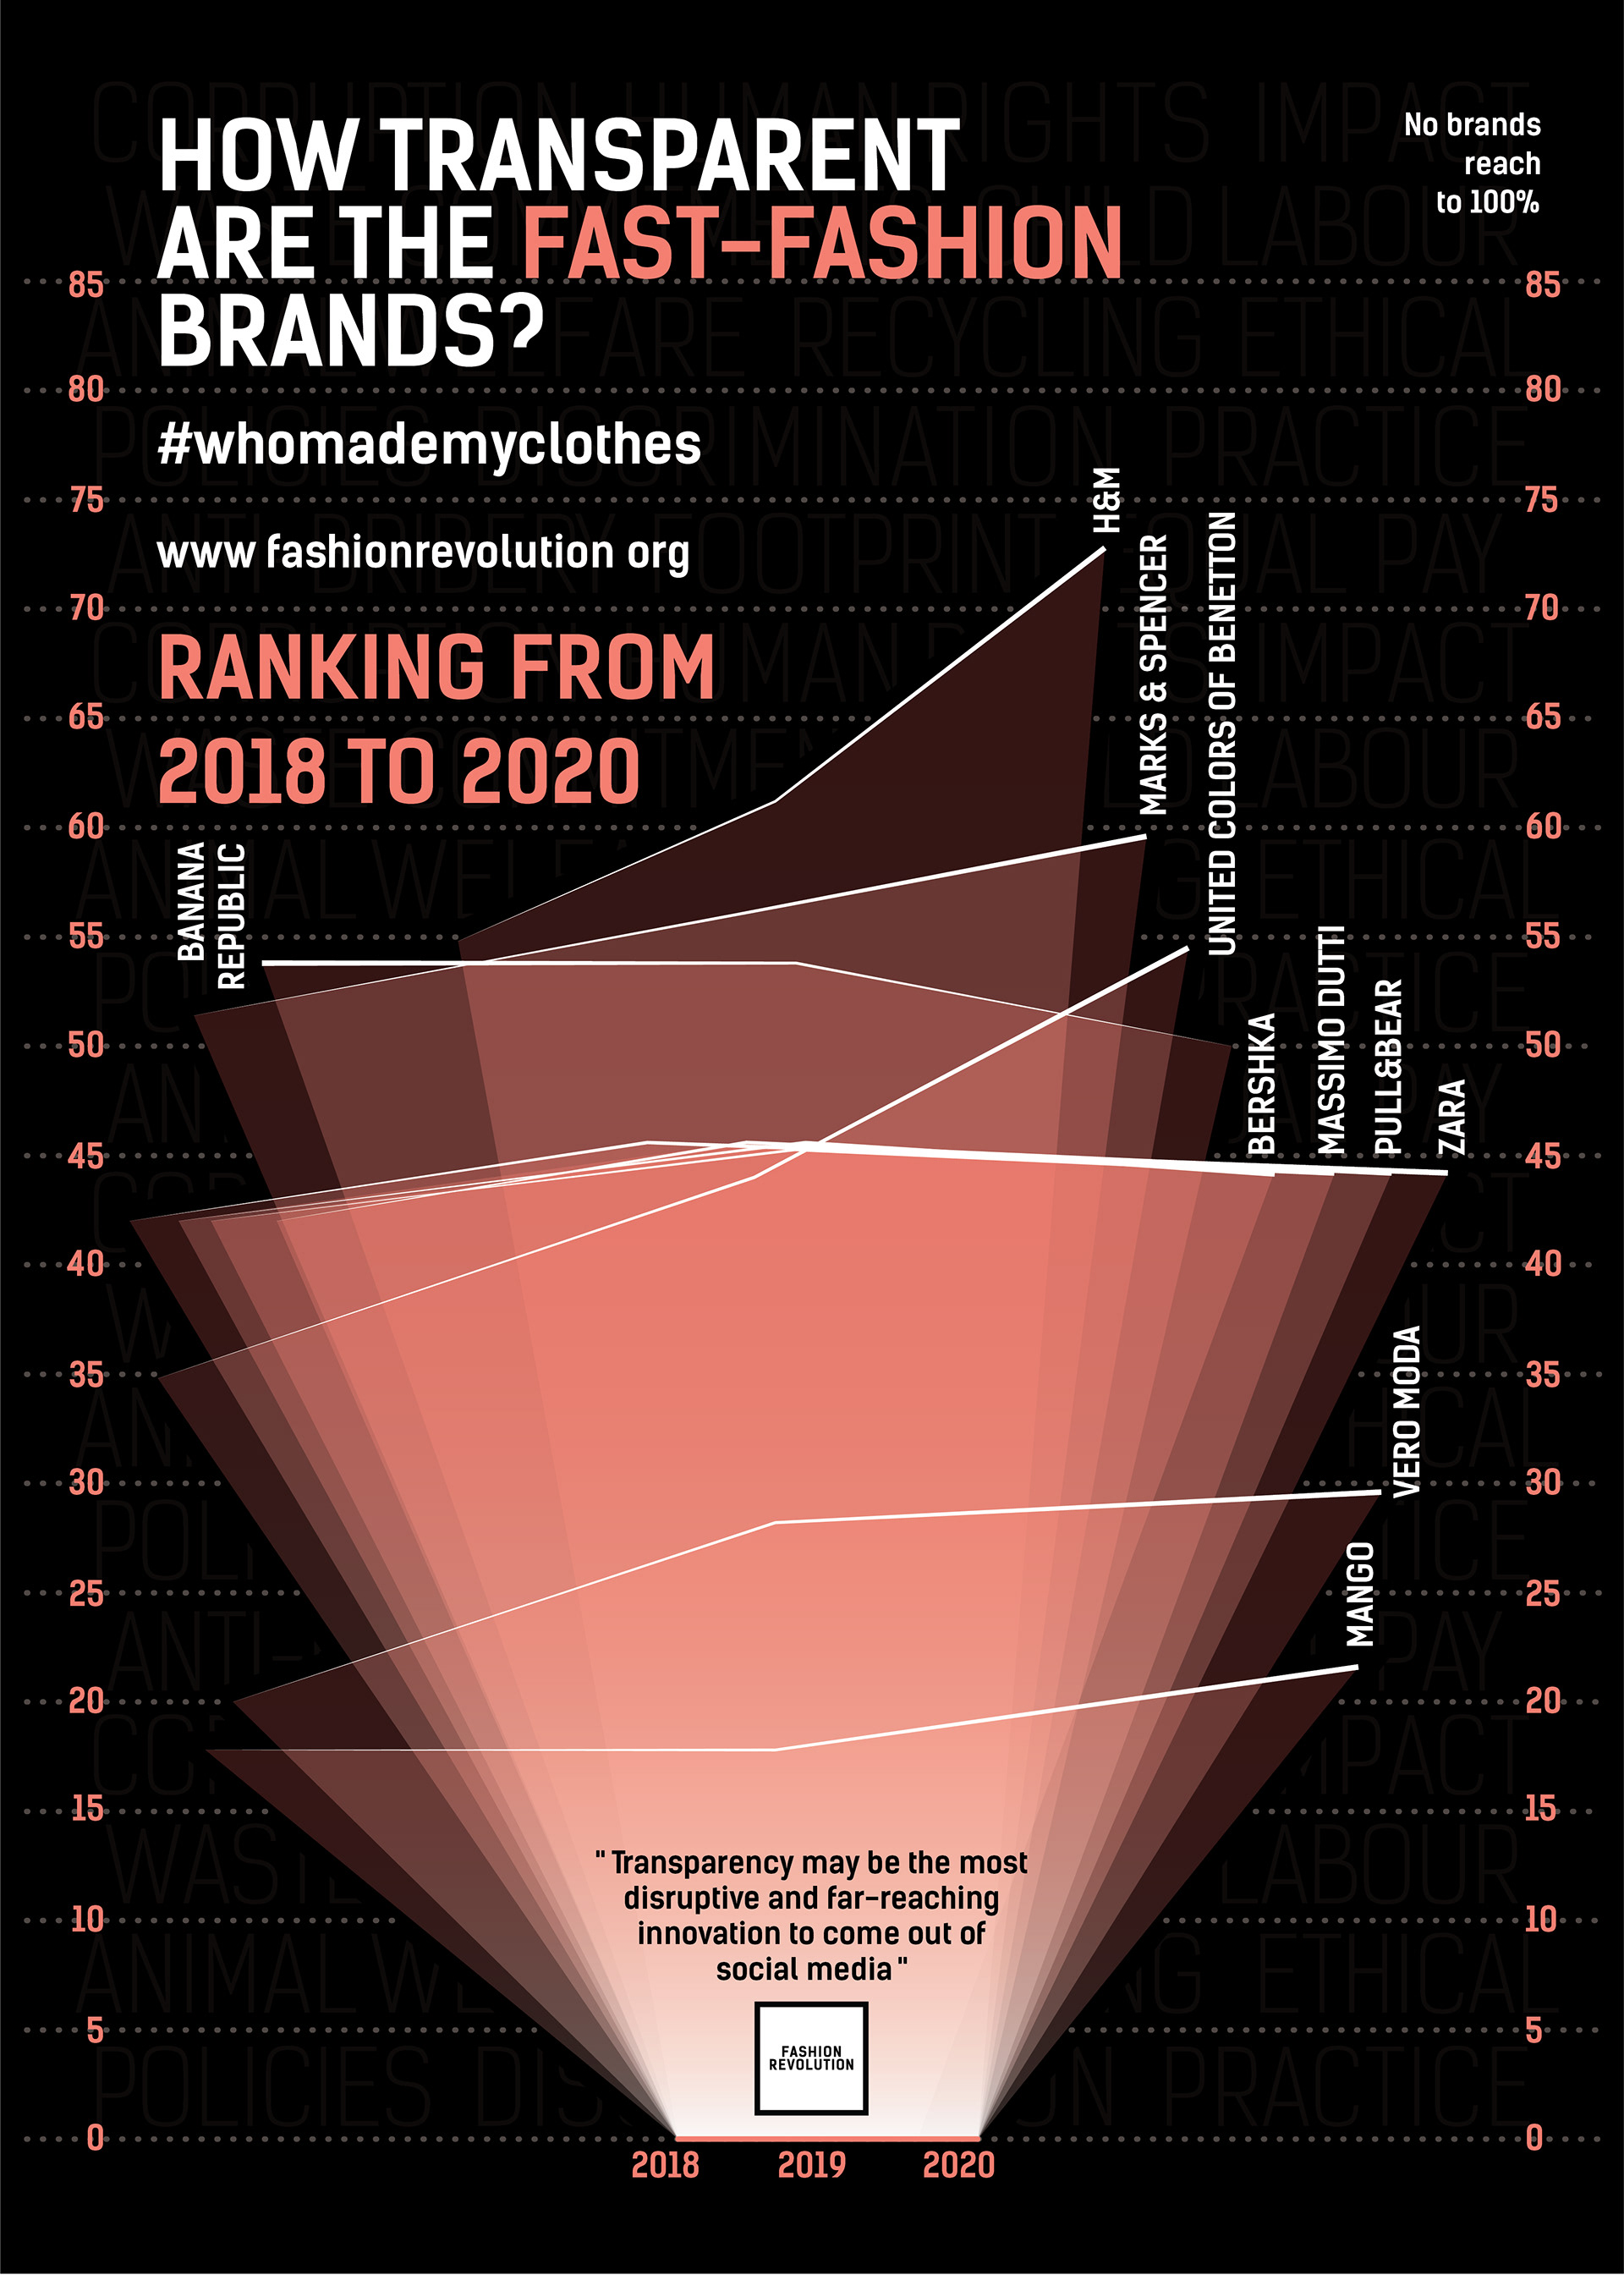
The series of graphics is divided by segment and showcases the ranking of the brands and are shown in almost any channel of promotion, thus its graphic content is versatile. The hashtag #whomademyclothes It's displayed in all designs to invite the consumer to be part of the movement and empower its role within the fashion industry as a dominating element that sets the rules in the industry.
Static Graphics
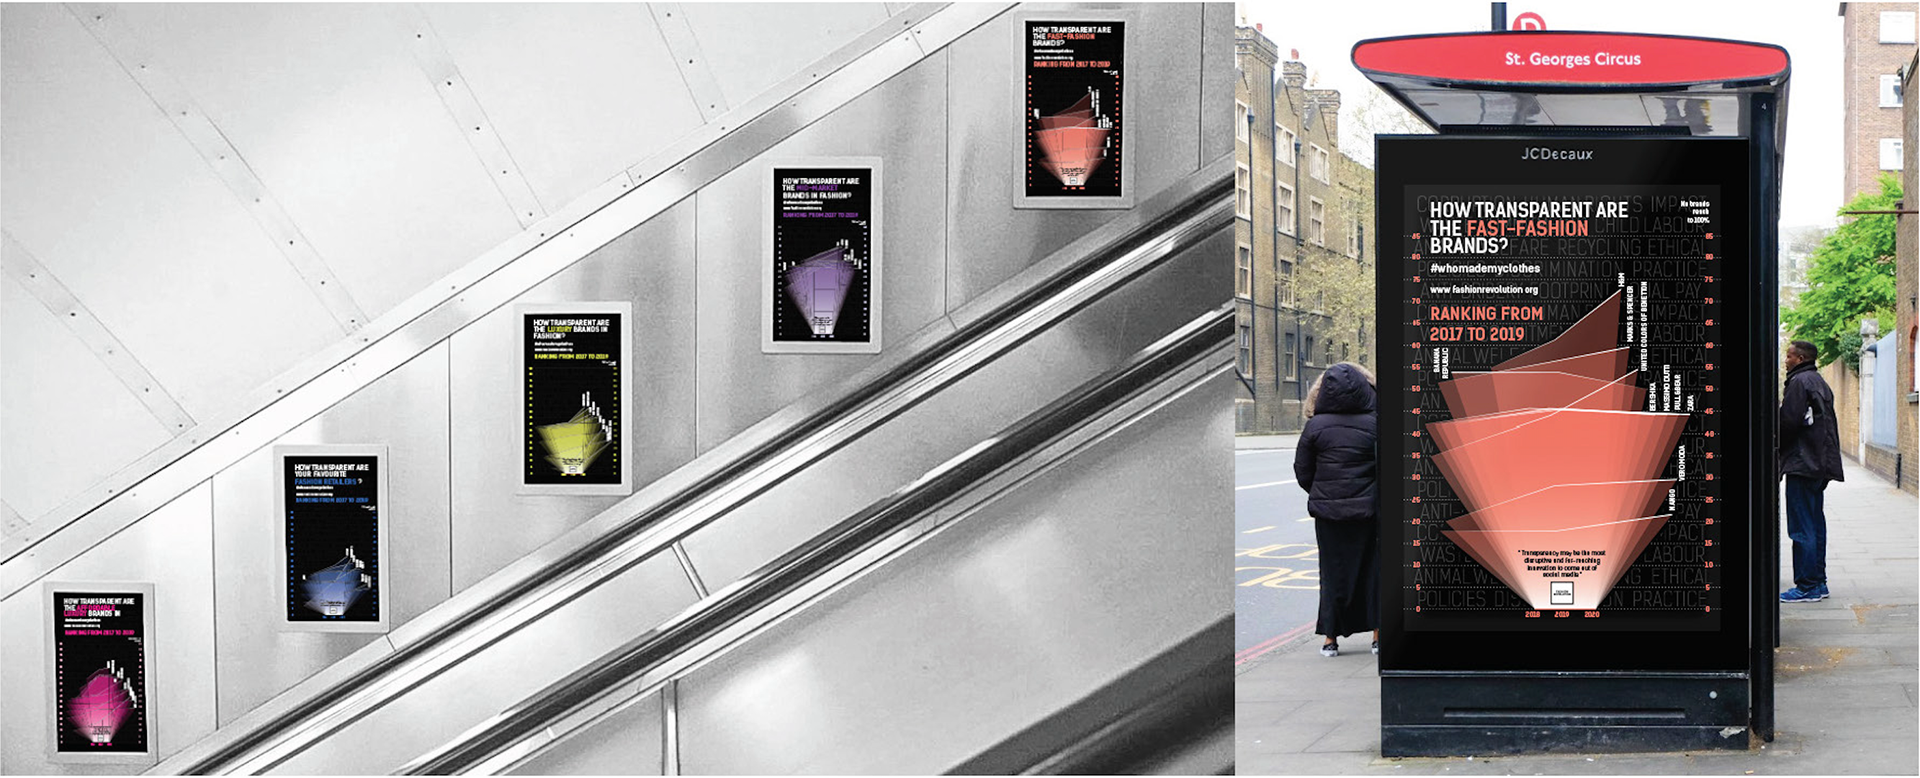
EXAMPLES ON WHERE THOSE THE GRAPHICS CAN BE SHOWN
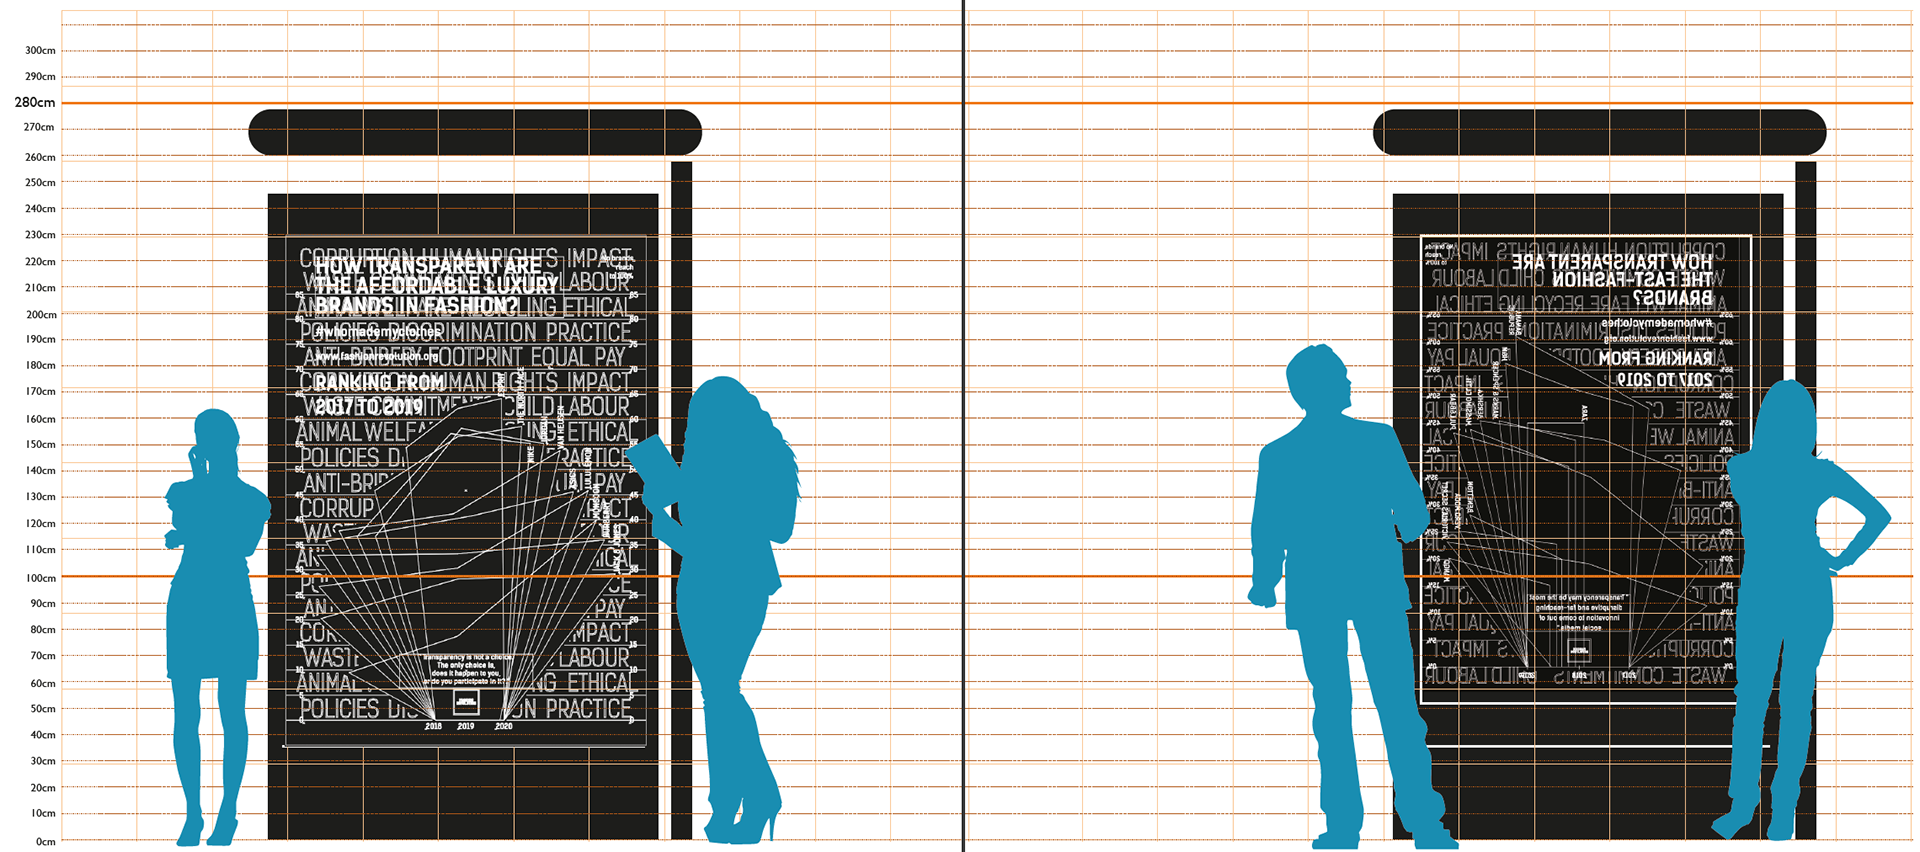
MEASUREMENTS IN A BOOK SHELTER

MOCK UP OF A BUSS SHELTER As it is mention, in brief, the poster care aimed to be published in different spaces, which can be buss shelters or the subway. The graphic on the bottom exemplified ideal size of the poster in a bus shelter to be appreciated.

EXAMPLES IN HOW IT LOOKS ON INSTAGRAM
Prototype


Both products were created during my master studies during the data visualisation module, therefore the website is a prototype that needs further development, and the illustrative graphics have’t been properly promoted.
A big thank you to Fashion Revolution for giving me the access to their research and database, as an information designer with journalism experience I acknowledge the huge work that is gathering and organising data. I also believe they have made an excellent contribution by realising the Fashion Transparency Index each year.