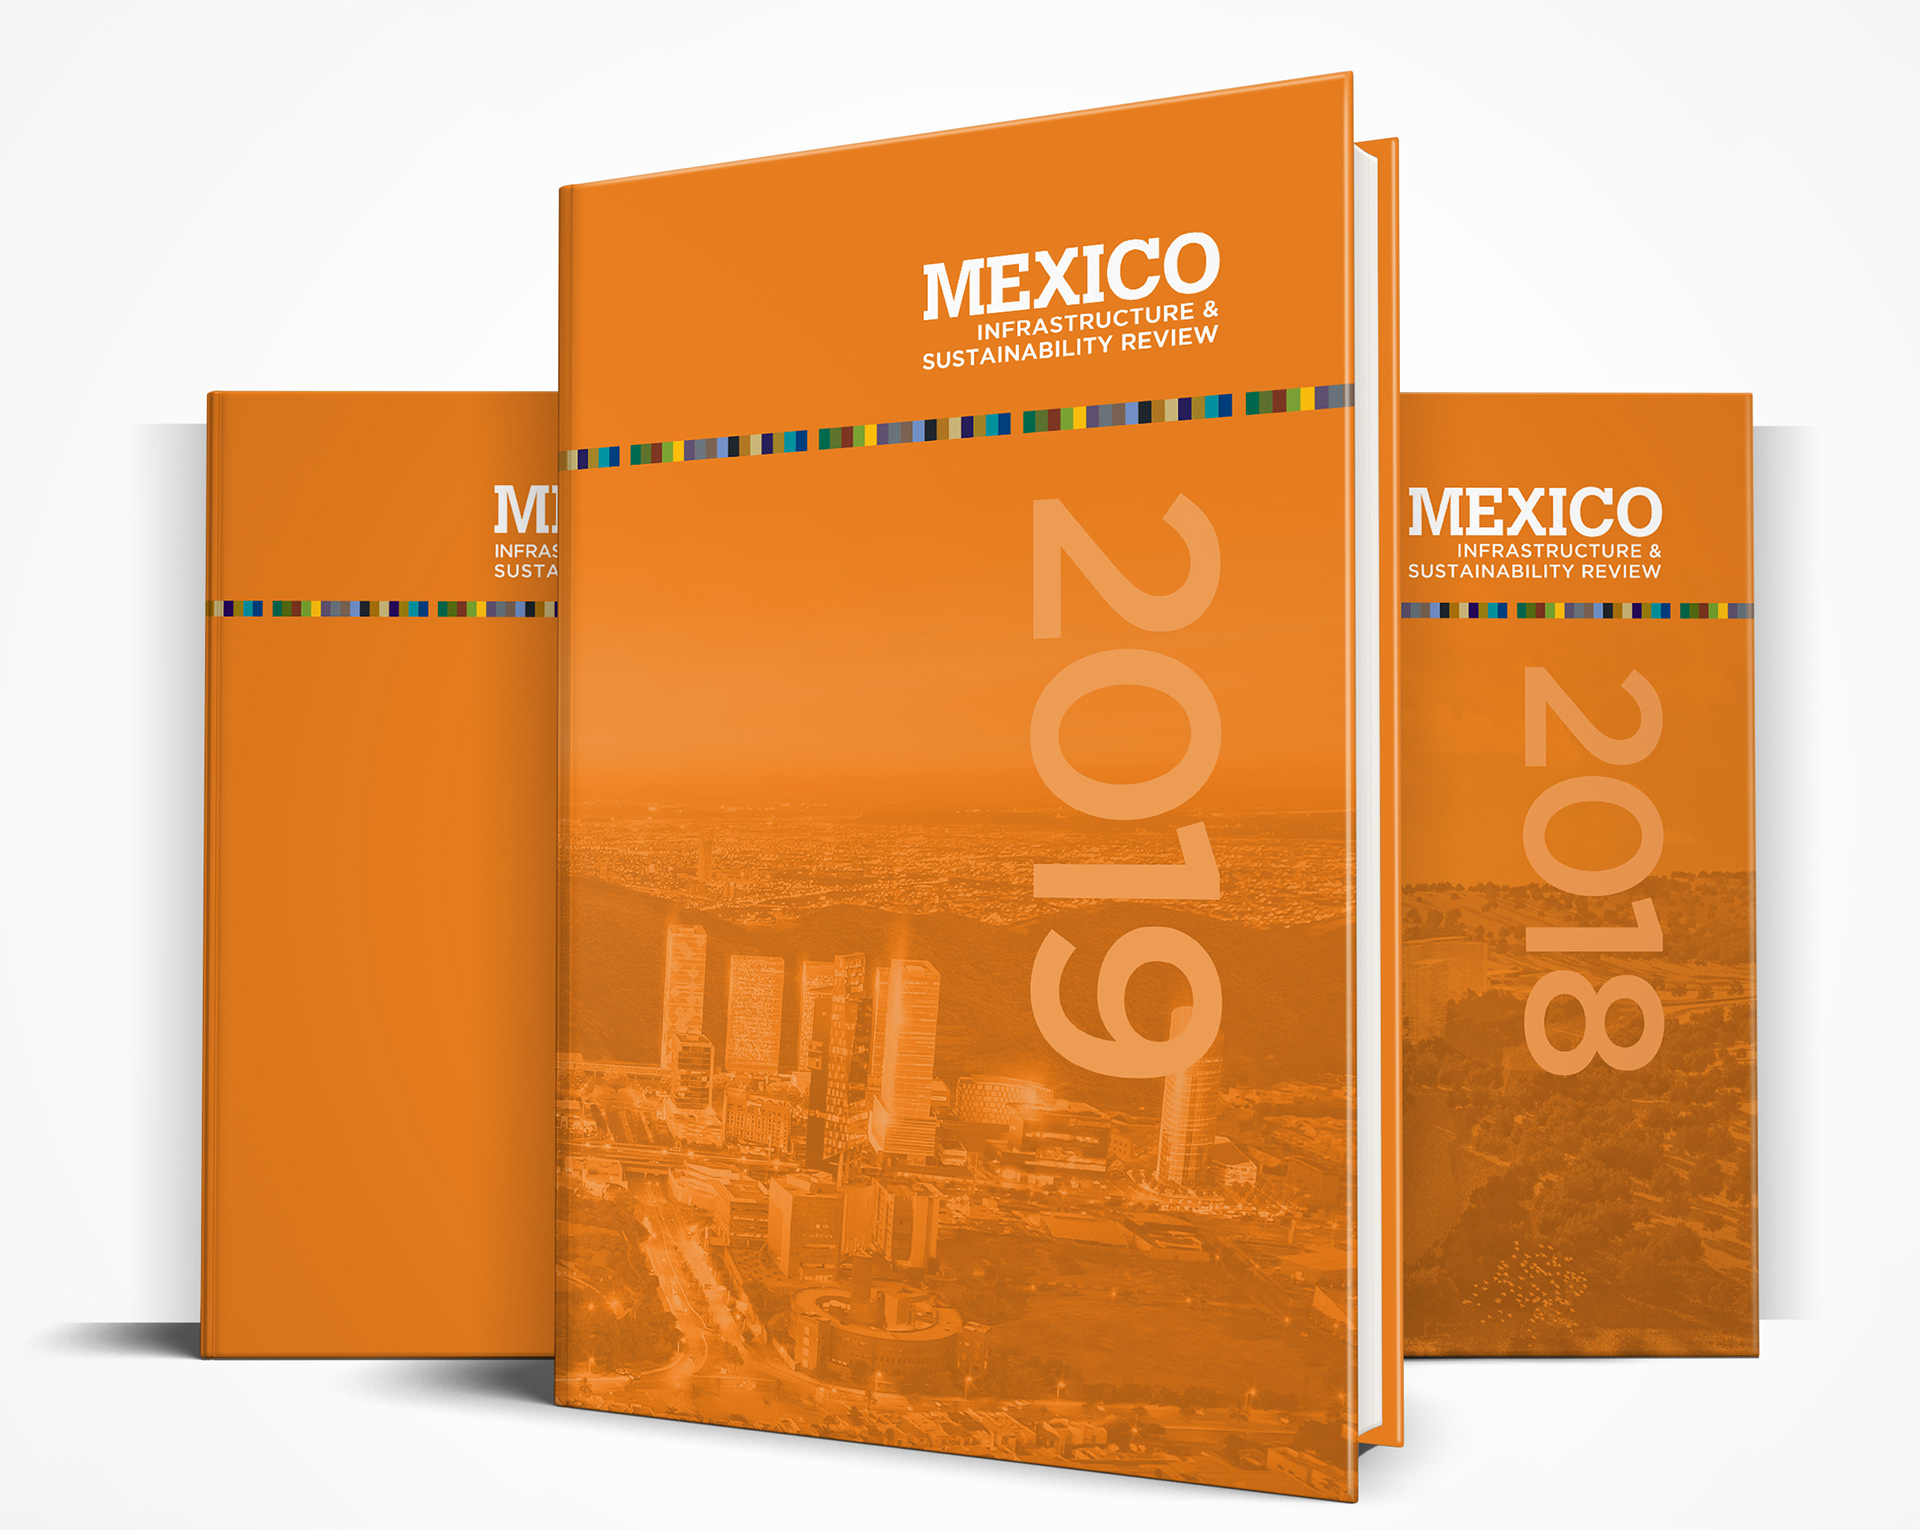
MBP's books' design is relatively standard because together they meant to create a collection, either owning books from the same industry or owning the books from different industries.
The colour of the publication is bright orange which makes it quite appealing. By 2018 and 2019 the cover and back cover share an image of a luxury complex of buildings subtly placed as a background in front of solid orange and using a soft light effect. This image needs it to be high quality; therefore, they were provided by the companies found in the book.
Architecture of the Information:
The books contain: a table of content with the signature colours of the company distribute by chapters, a table of content and introduction per chapter, articles about the industry, photographs, interviews, expert opinions, quotes, facts with icons, charts, tables, infographics or data visualisation, companies profile, spotlights, advertising and so on.
The books contain: a table of content with the signature colours of the company distribute by chapters, a table of content and introduction per chapter, articles about the industry, photographs, interviews, expert opinions, quotes, facts with icons, charts, tables, infographics or data visualisation, companies profile, spotlights, advertising and so on.
Layout: five columns are the book's base, but the content is often distributed between one or two columns except for the infographics.
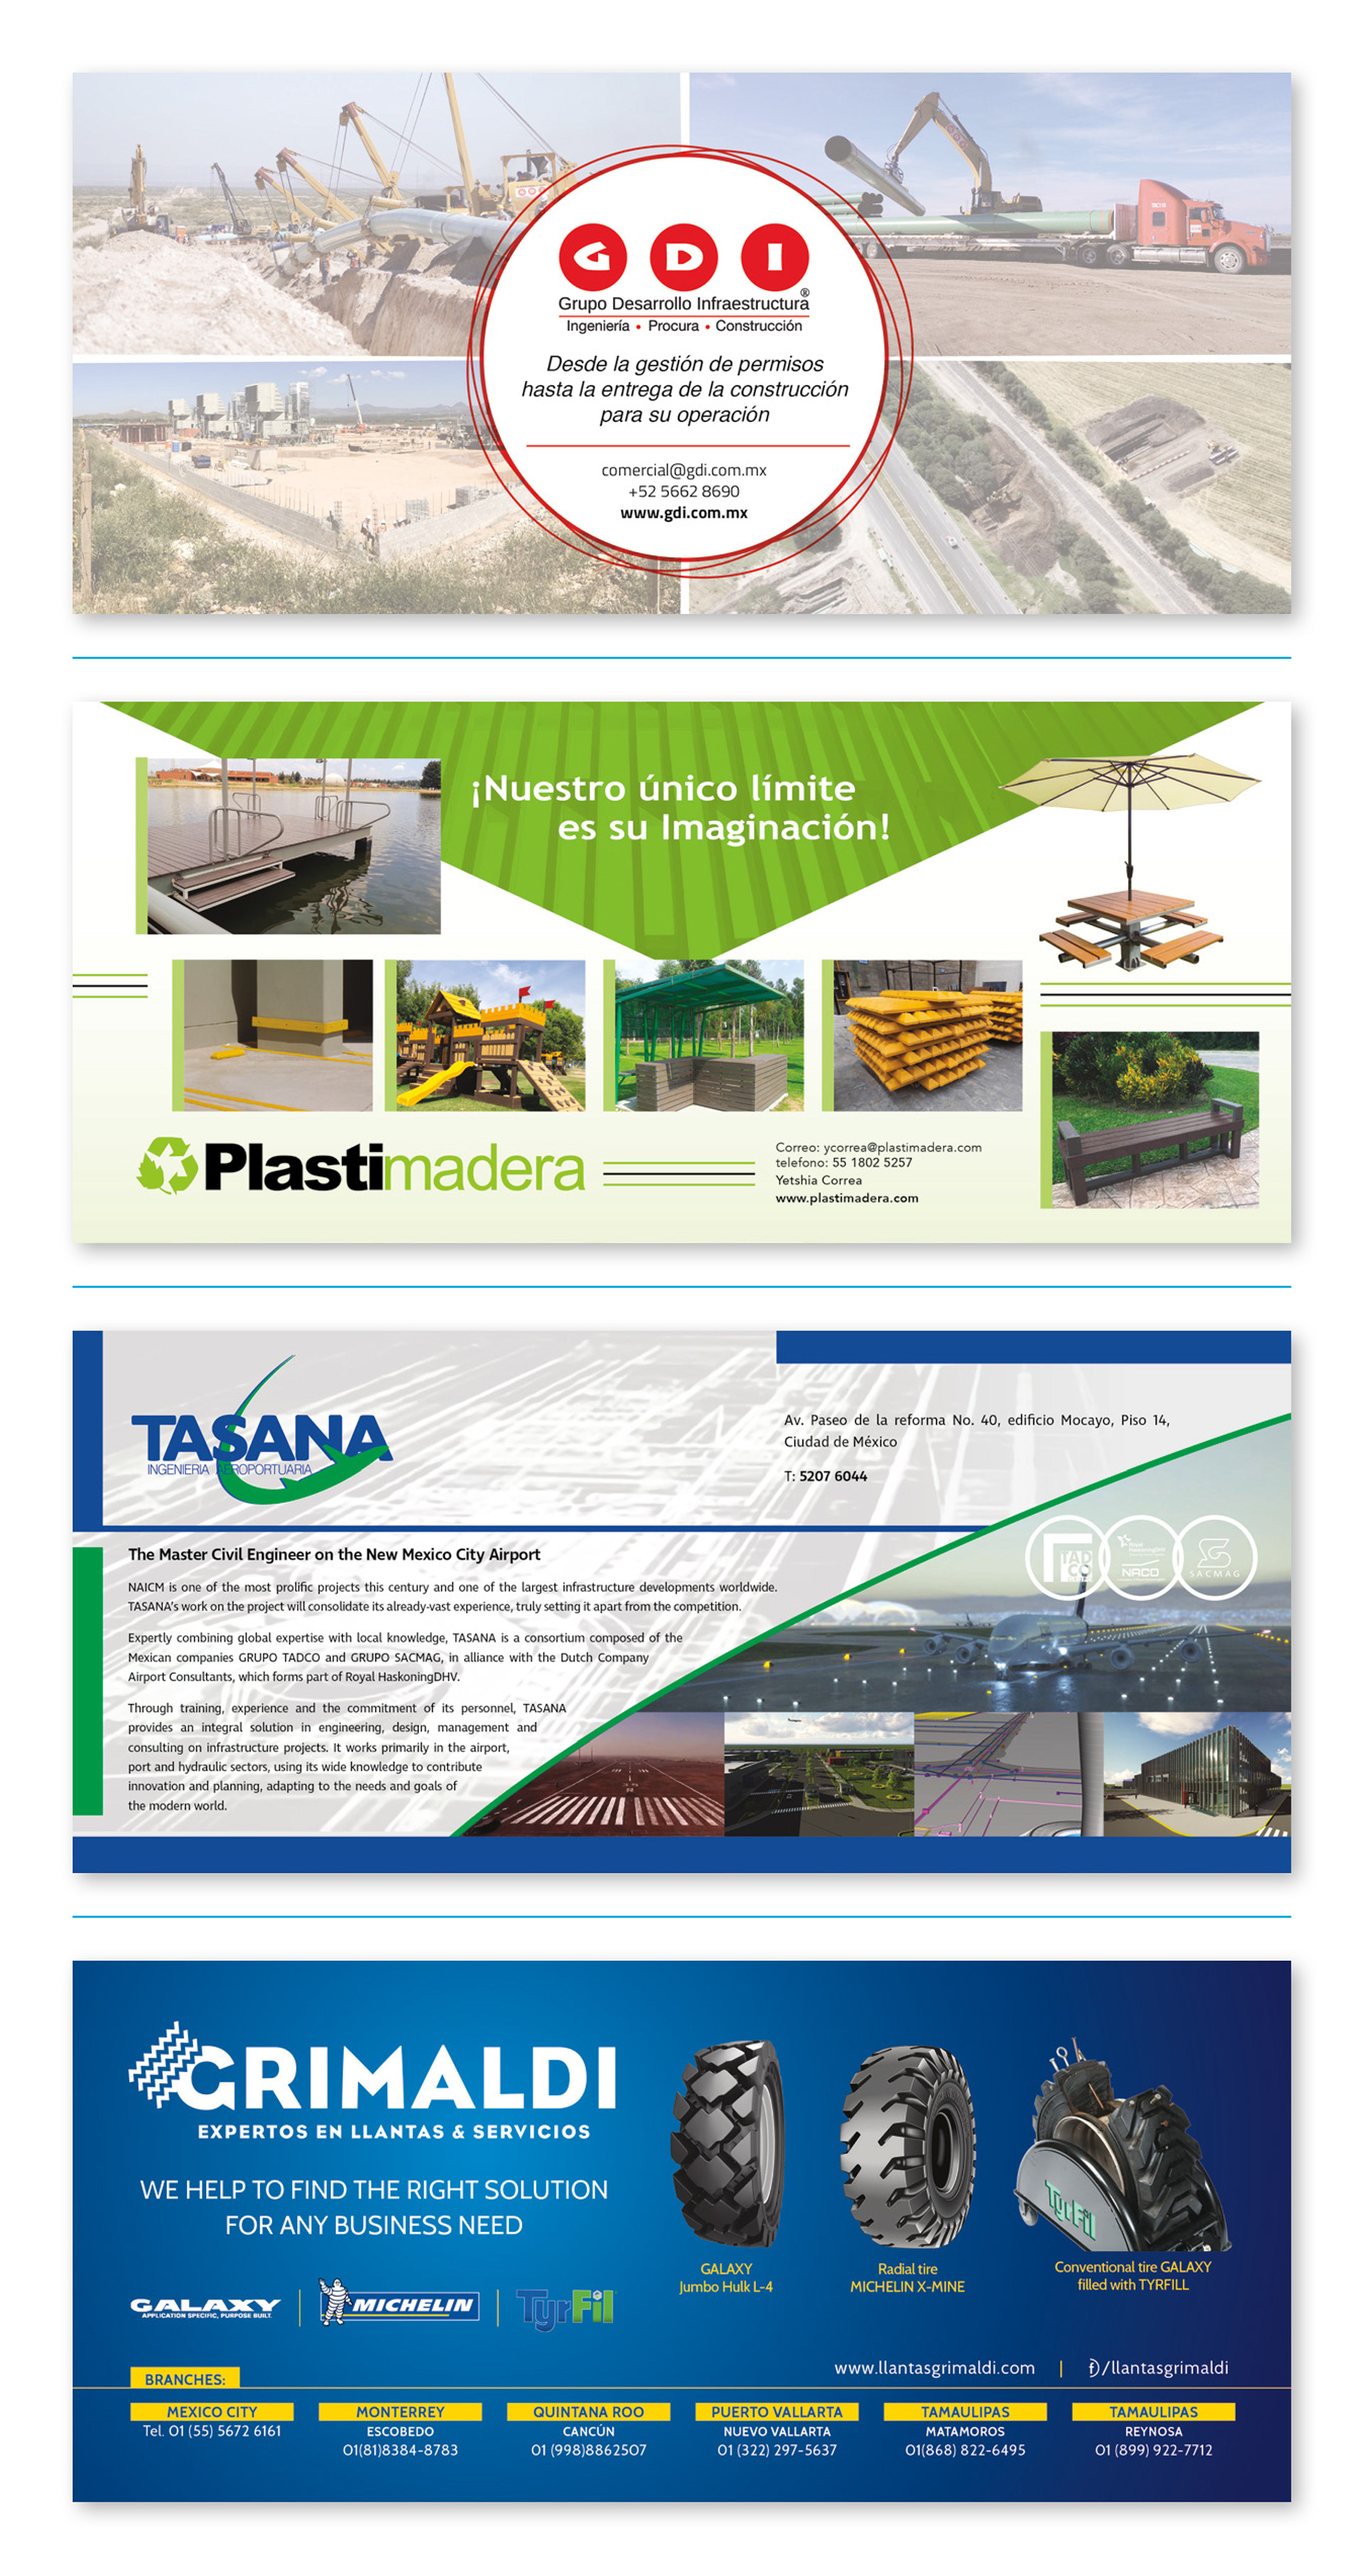
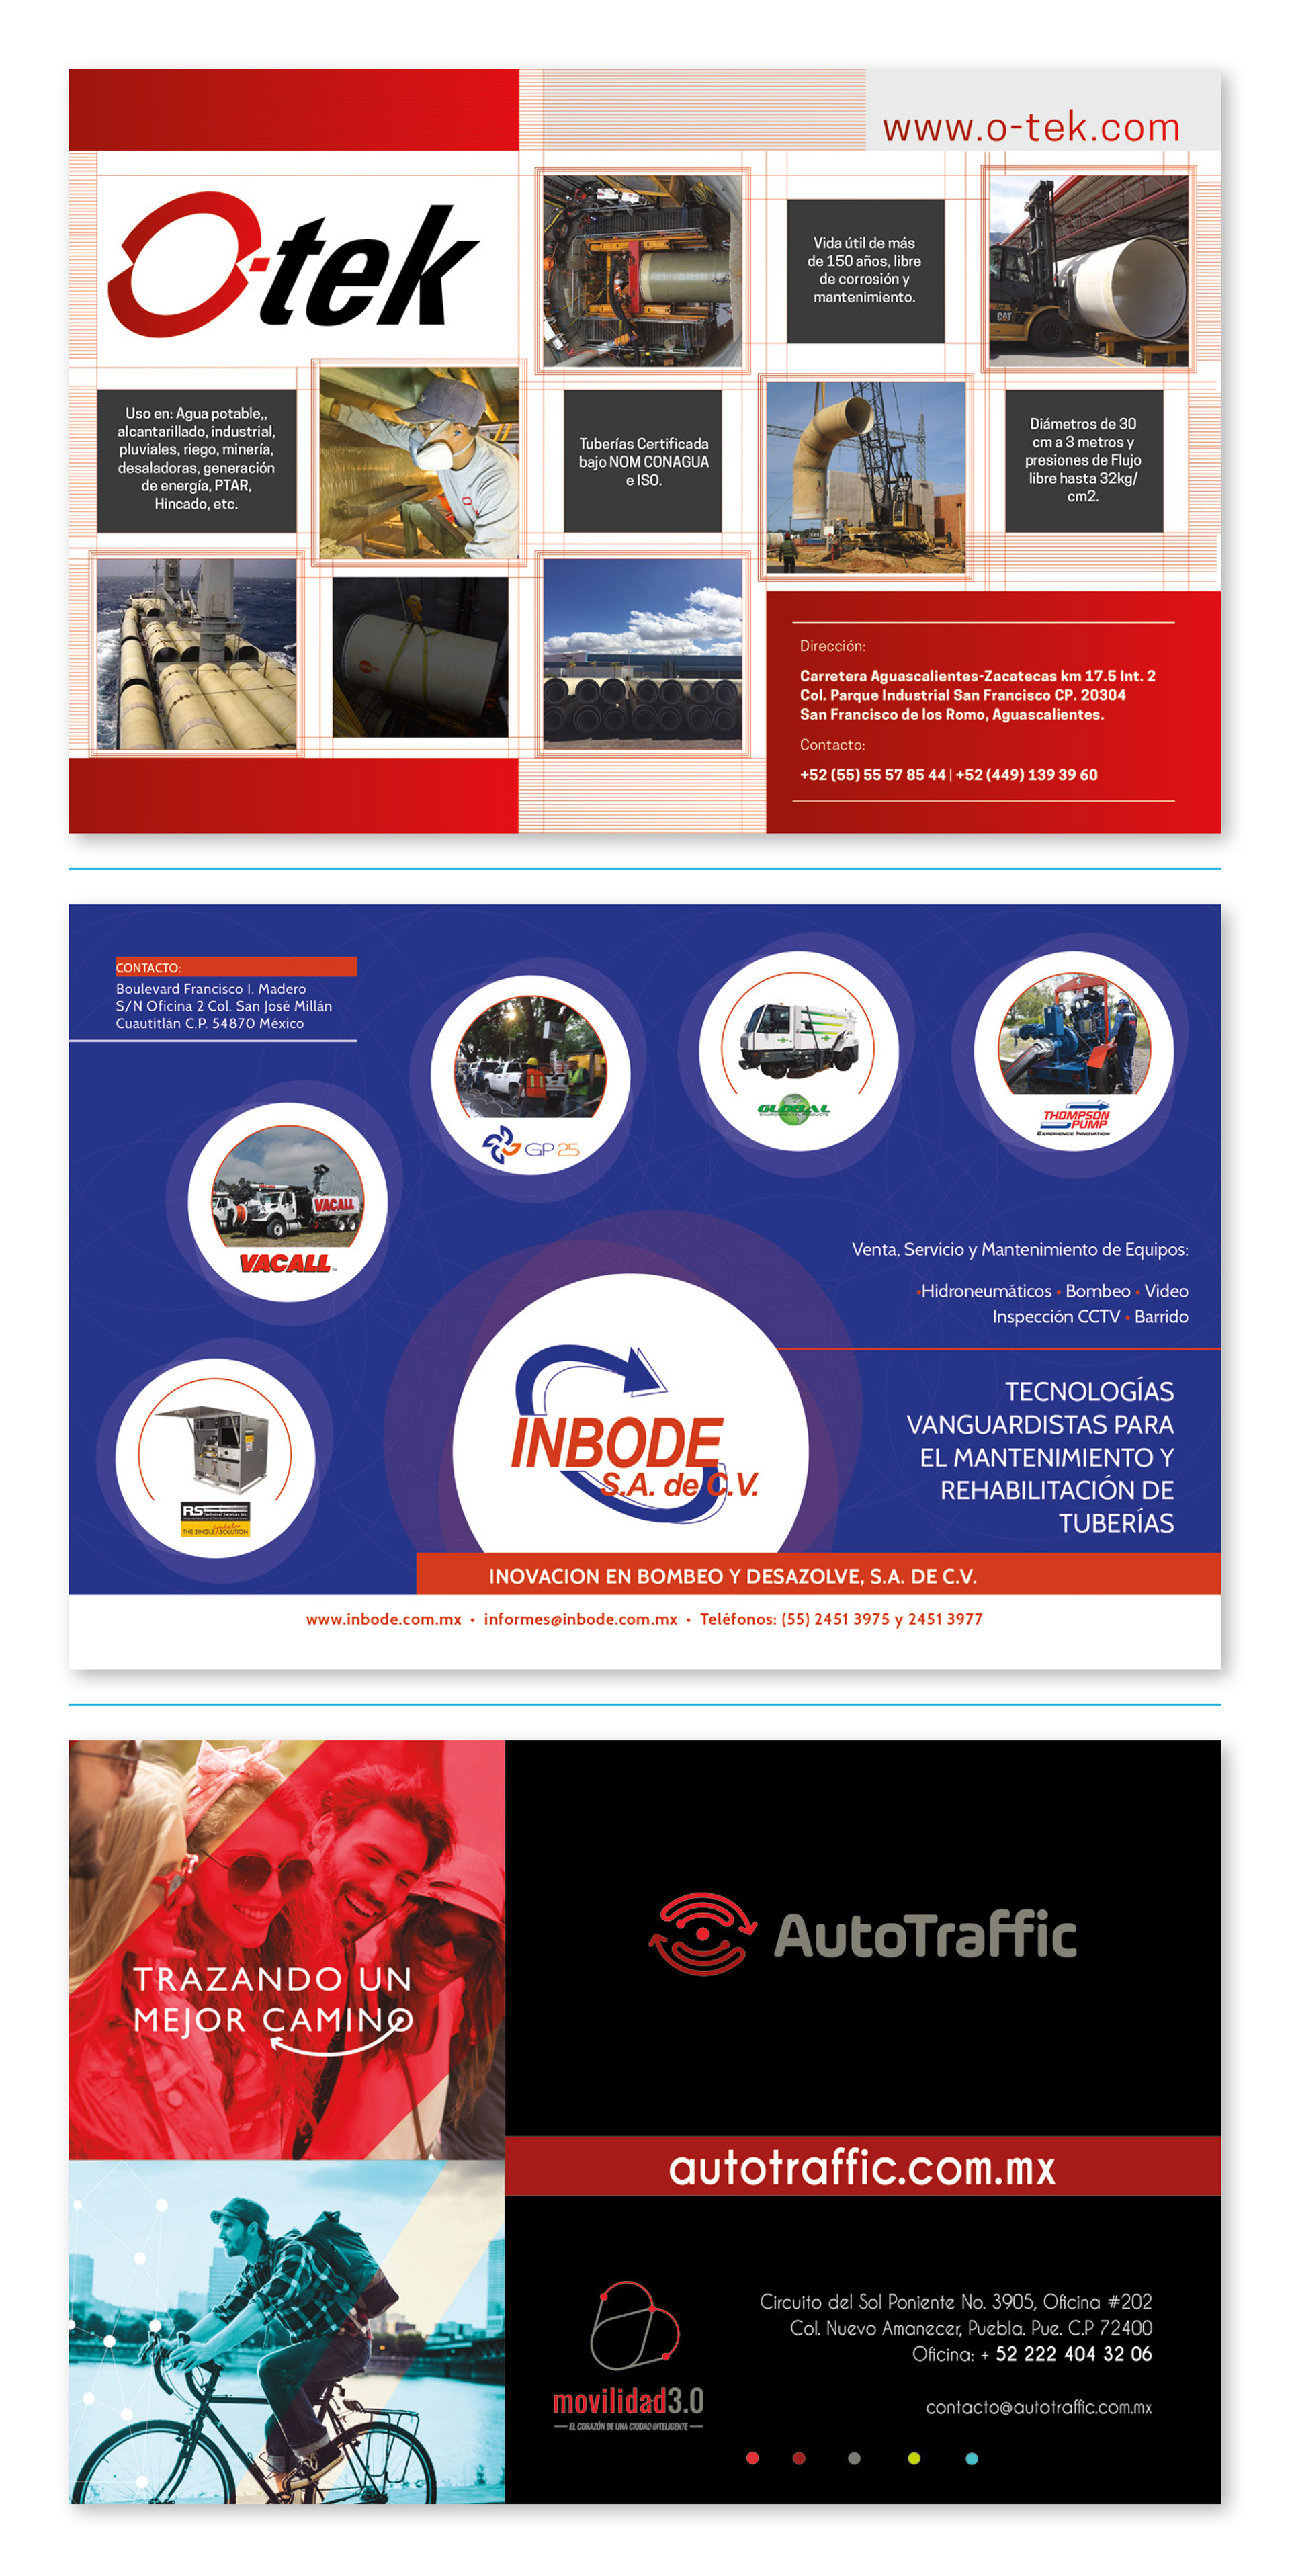
Advertising
The advertising was obtained by either requesting it from the clients or created by MBP's design team from which I was part.
There is 5 type of advertisings divided by size, but their cost depends on their location within the book. Here are 12 advertisings that I pull together for three of the editions of Mexico Infrastructure review.
1/3
1/2 Horizontal
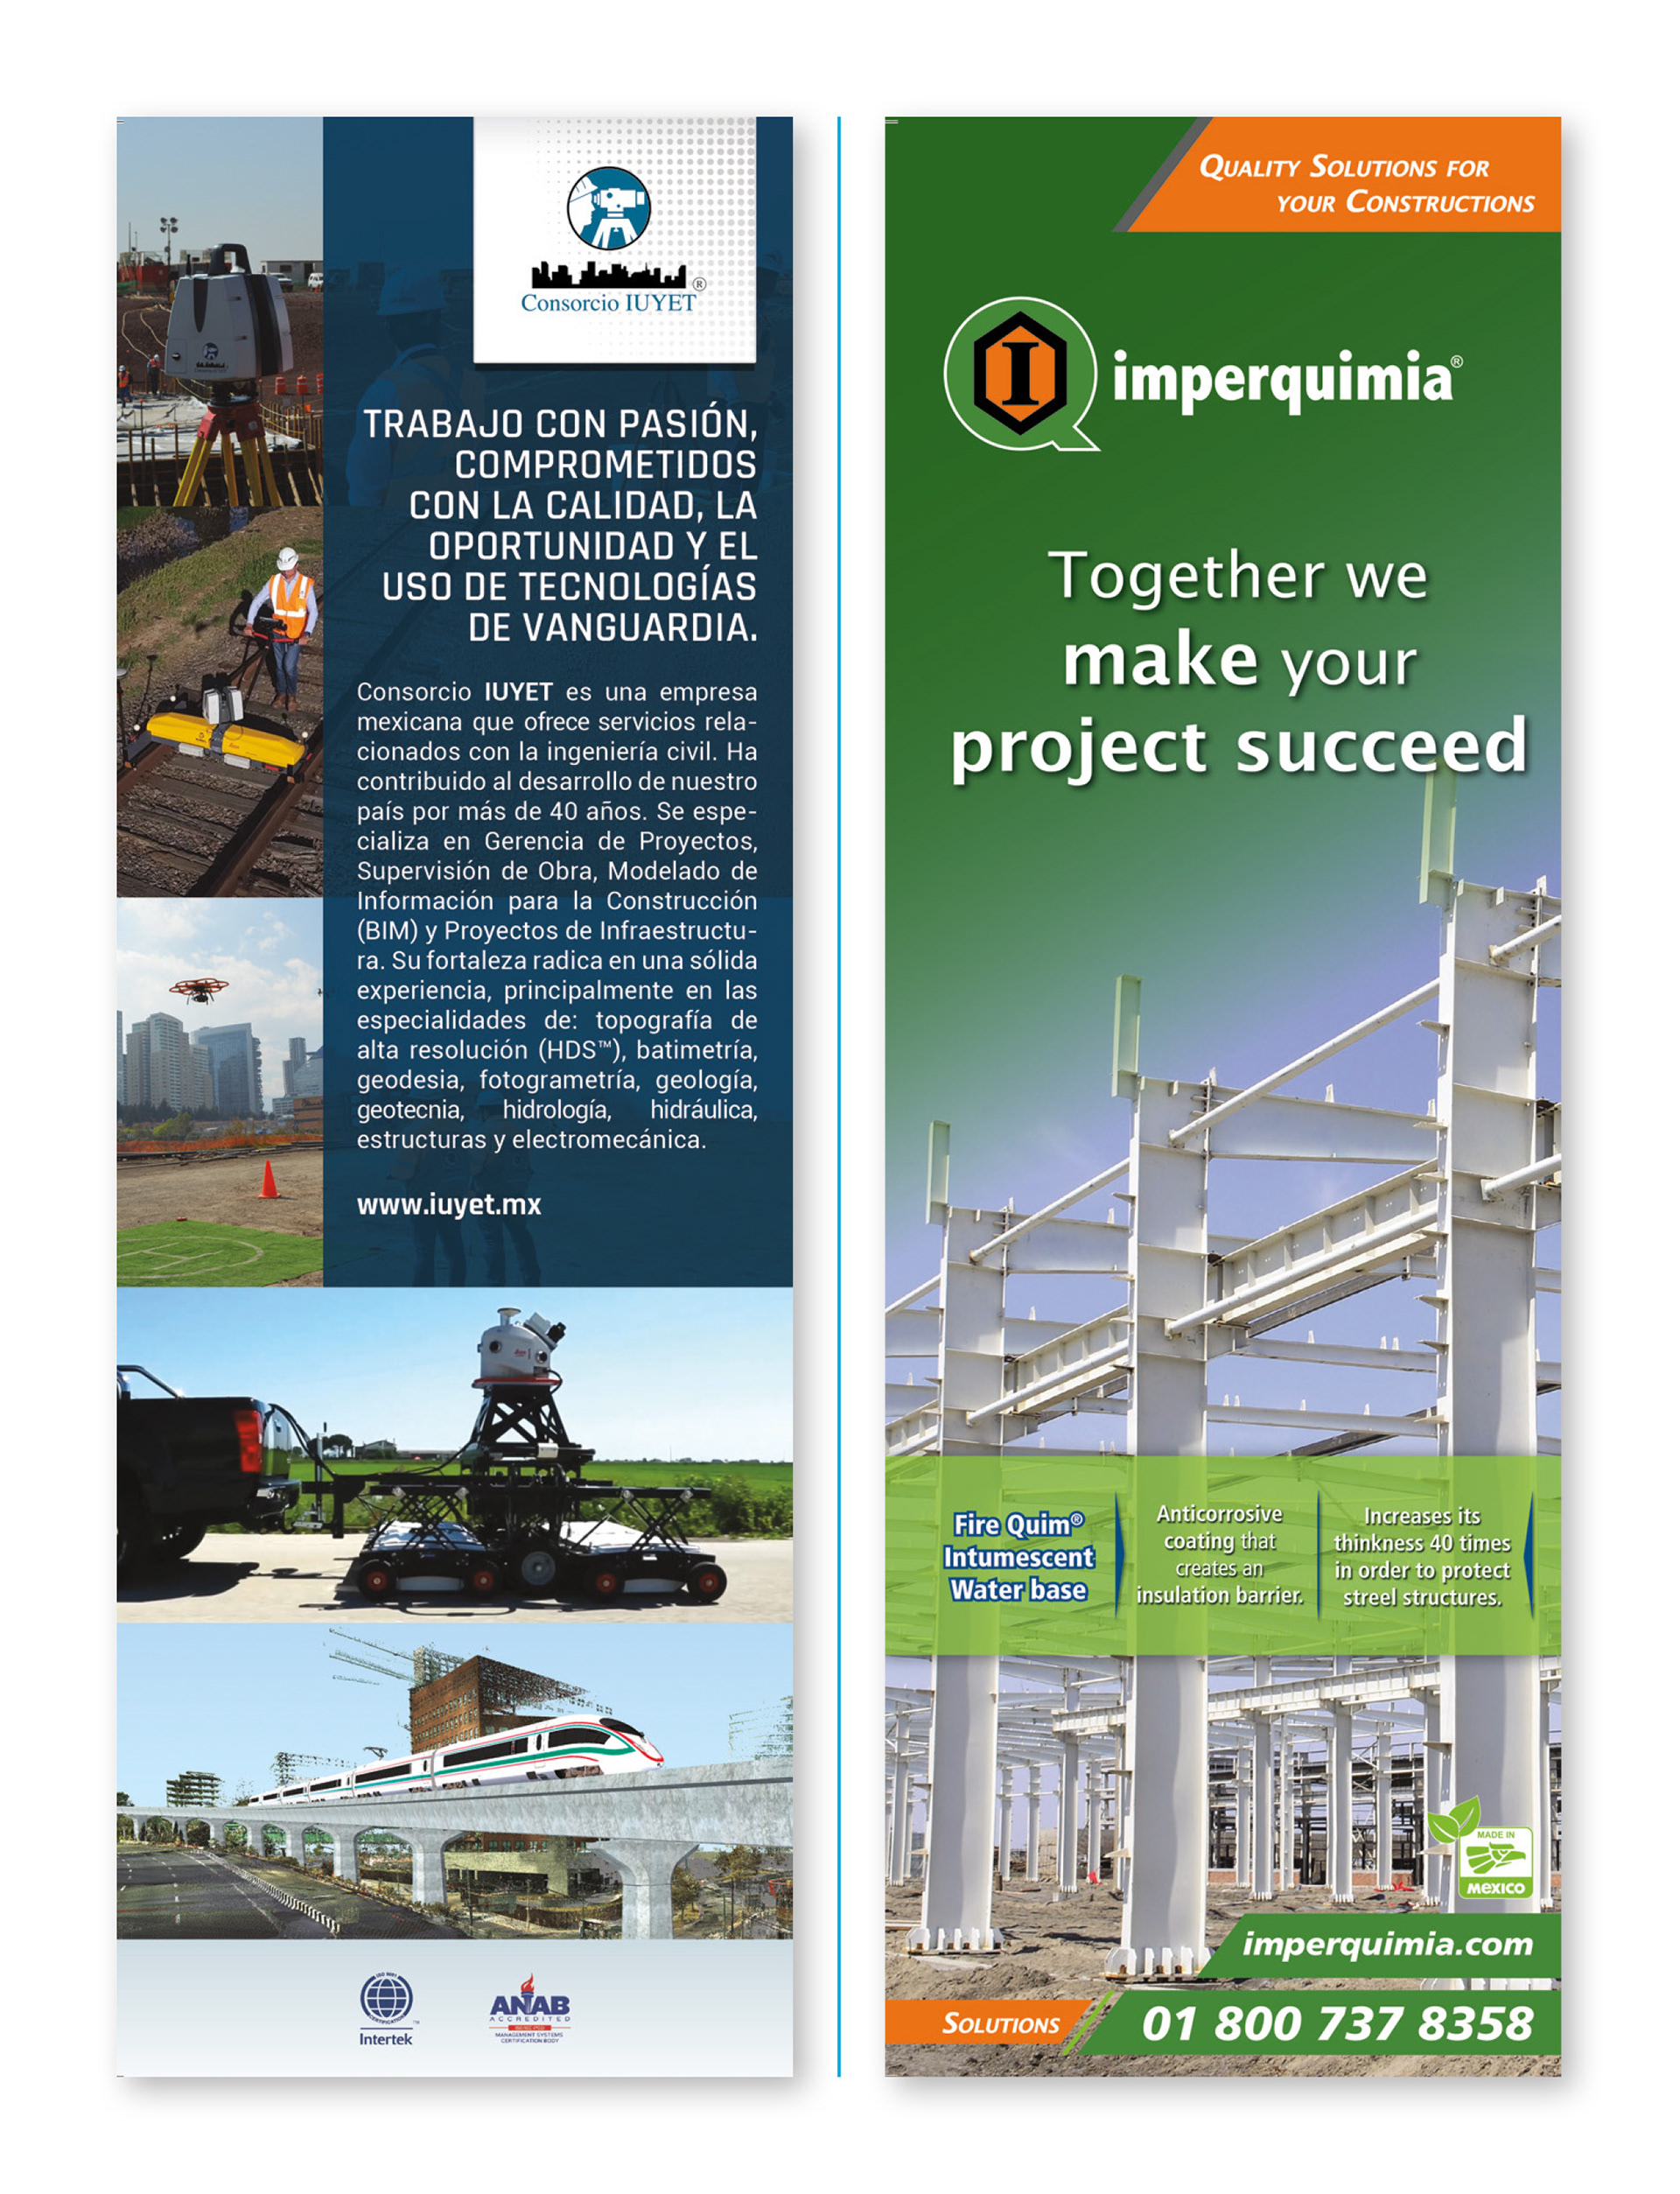
1/2 Vertical
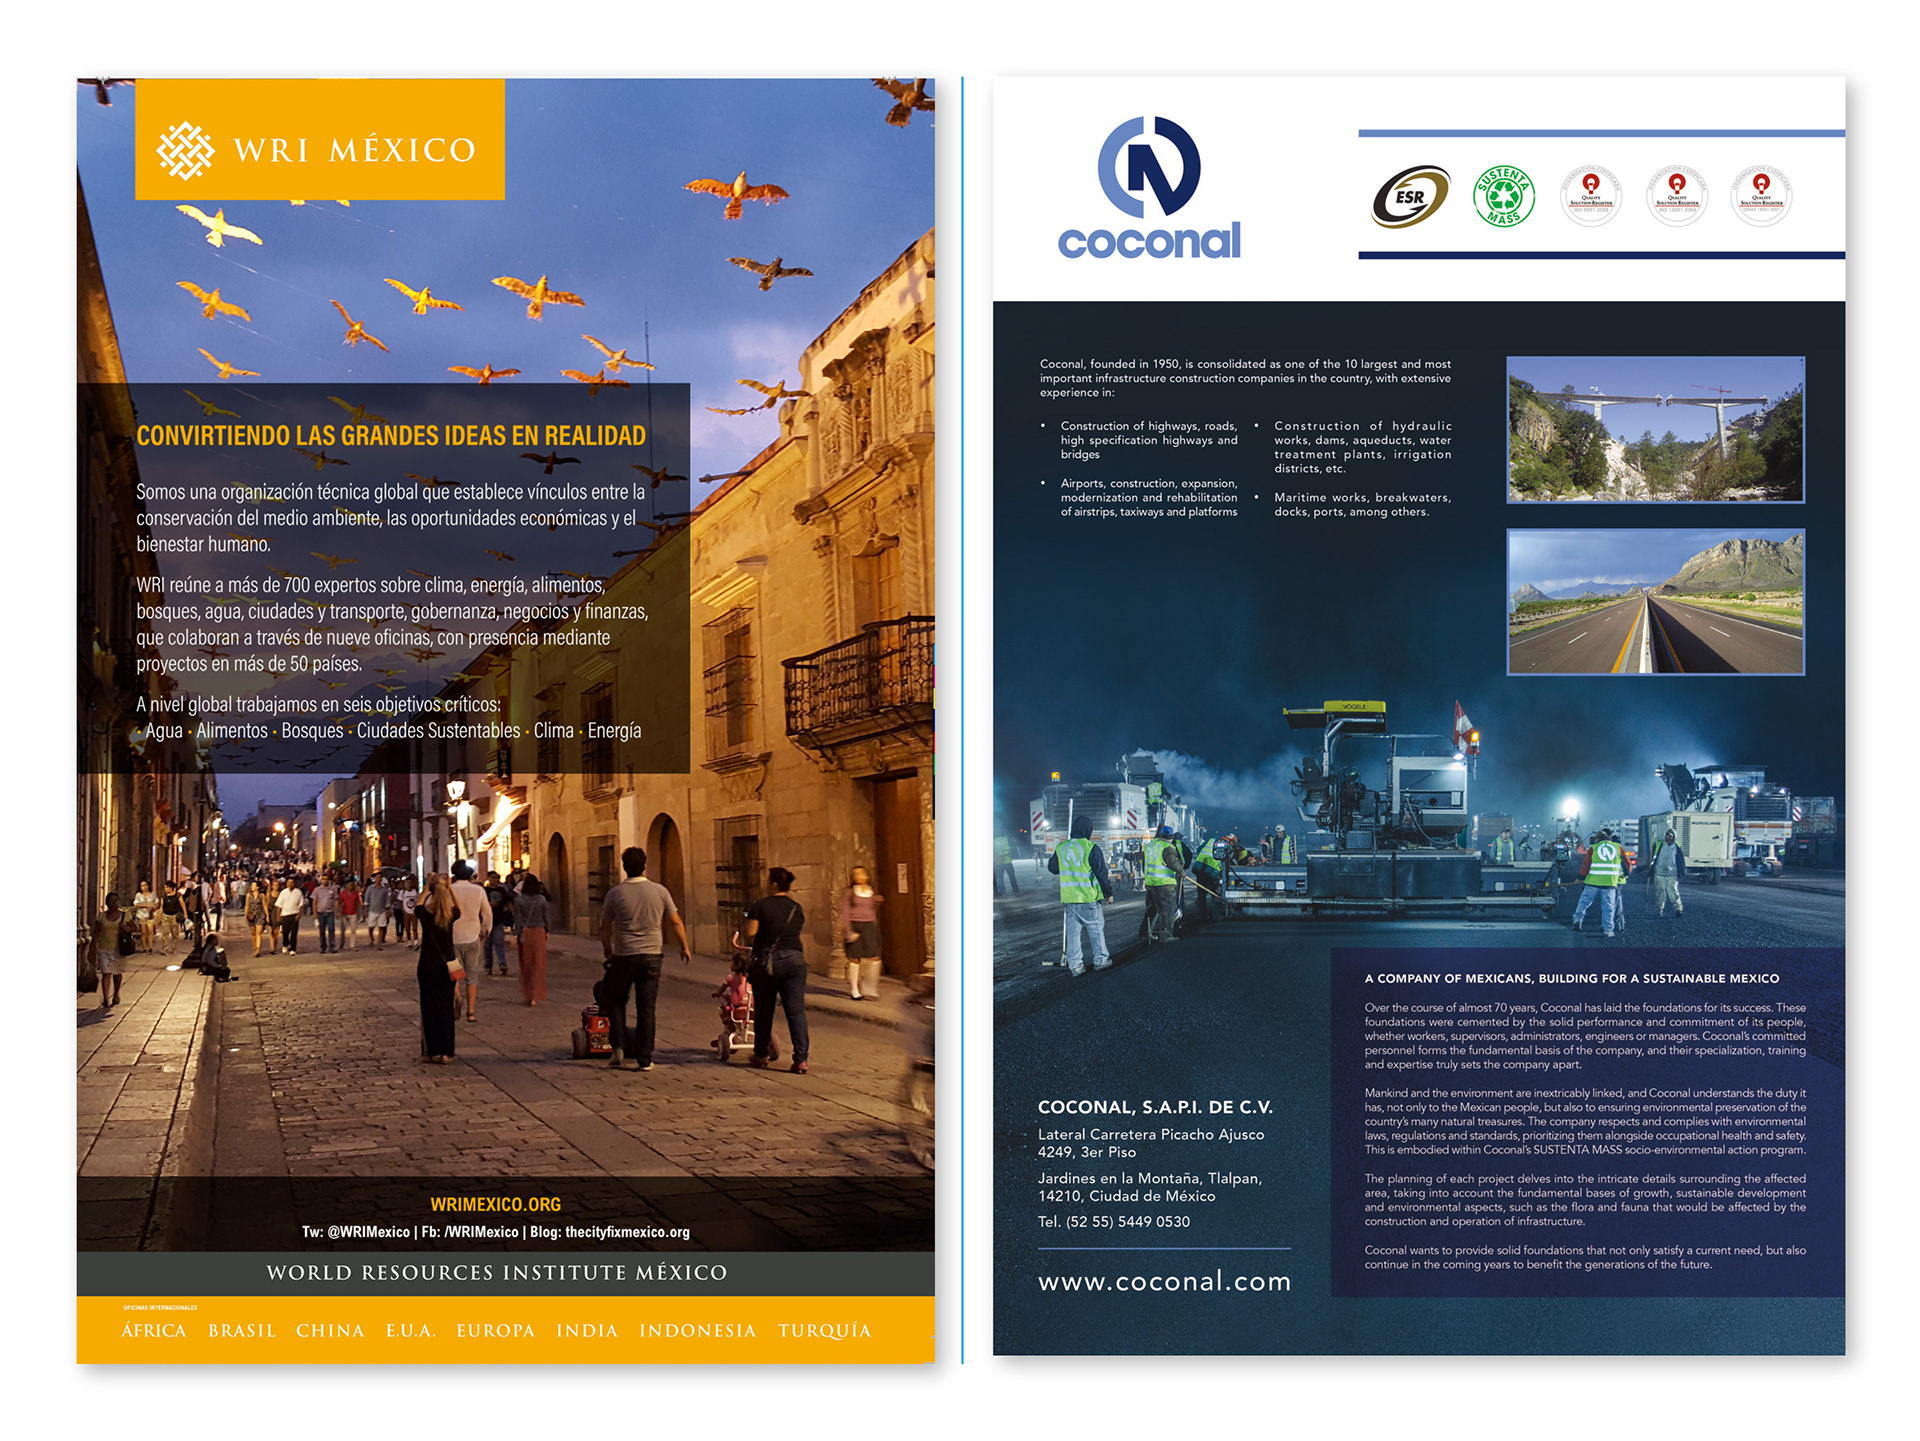
Full Page
Full Spread
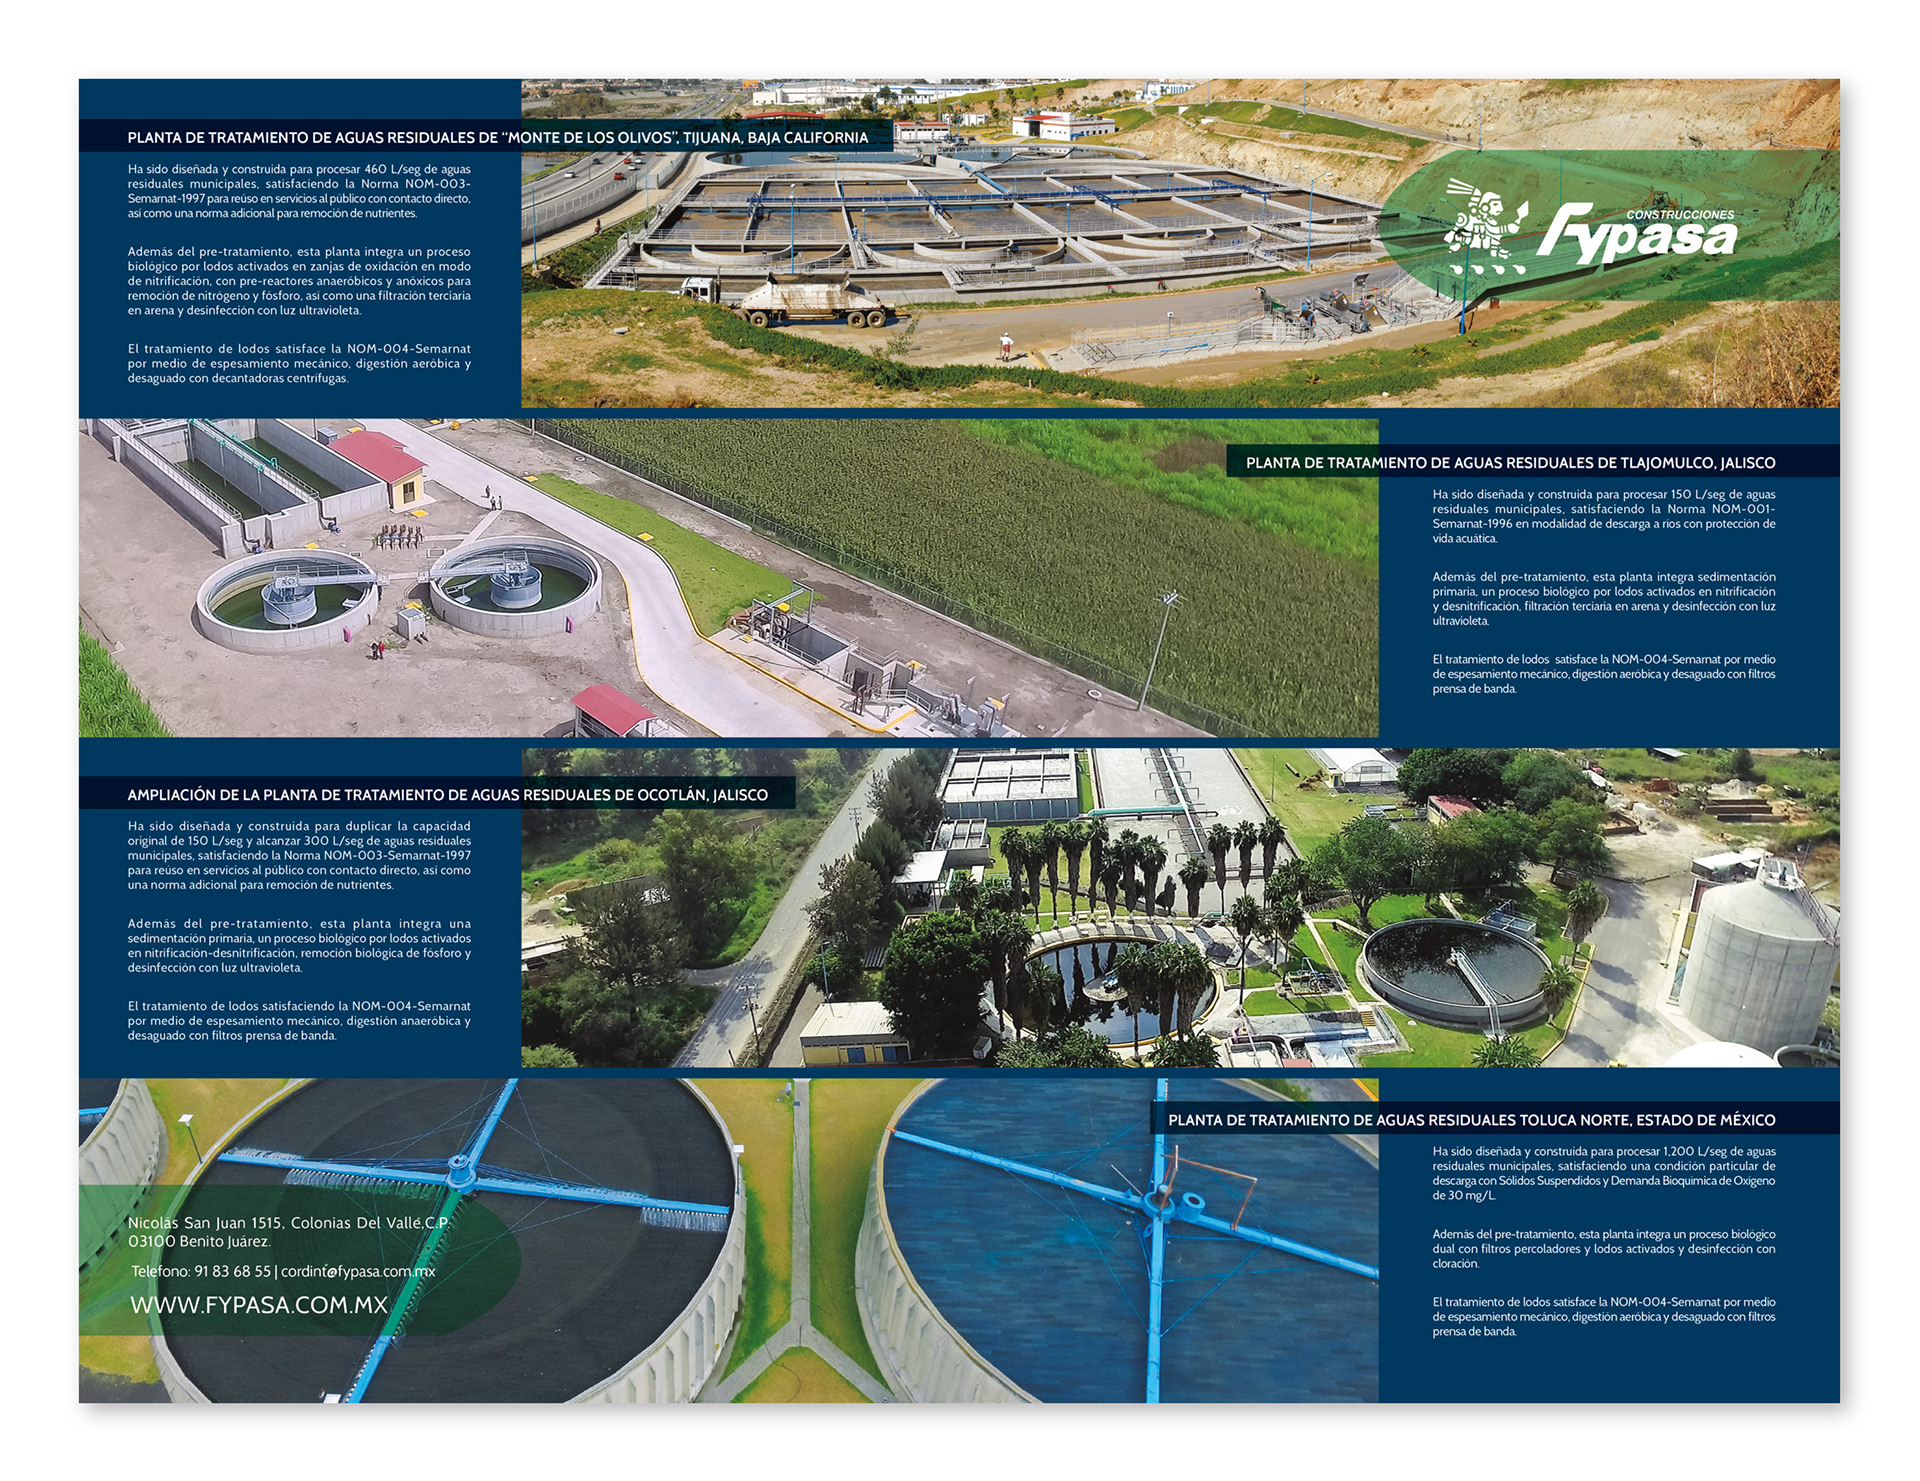
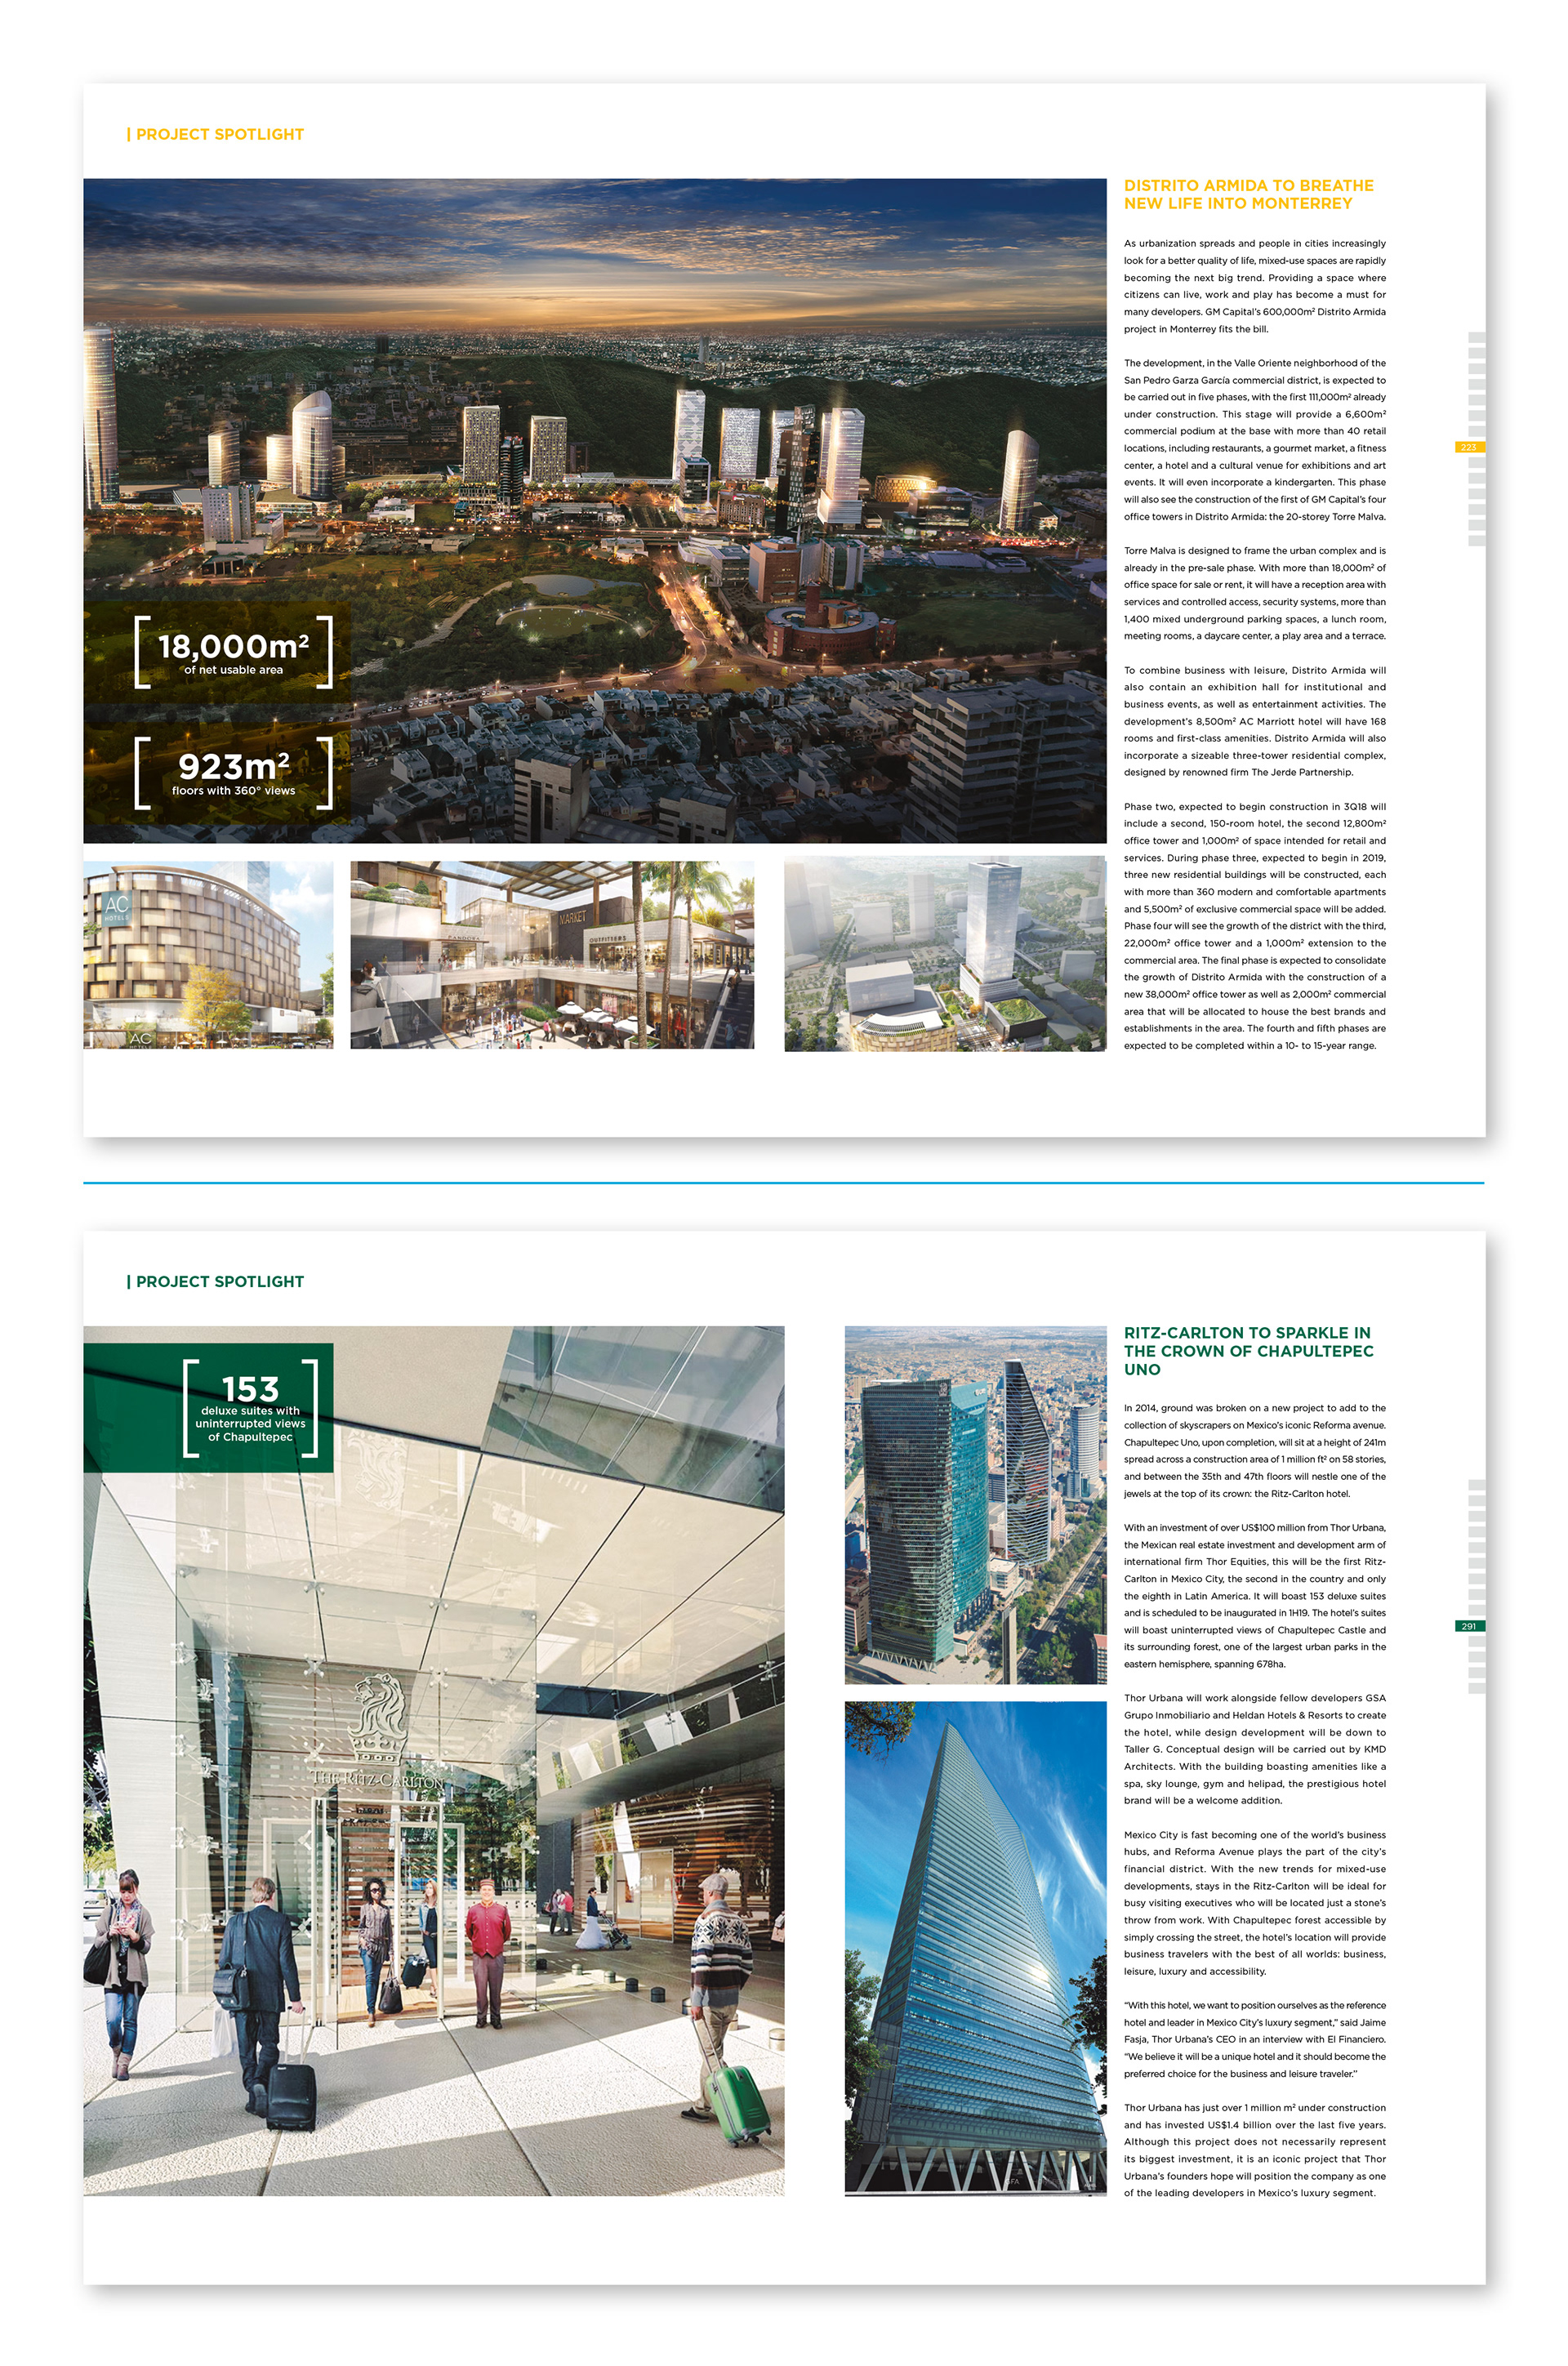
Spotlights
The spotlights aim to showcase a product or service and its characteristics. Therefore, it might contain an image or a series of pictures carefully selected accompanied of editorial content.
Photographies:
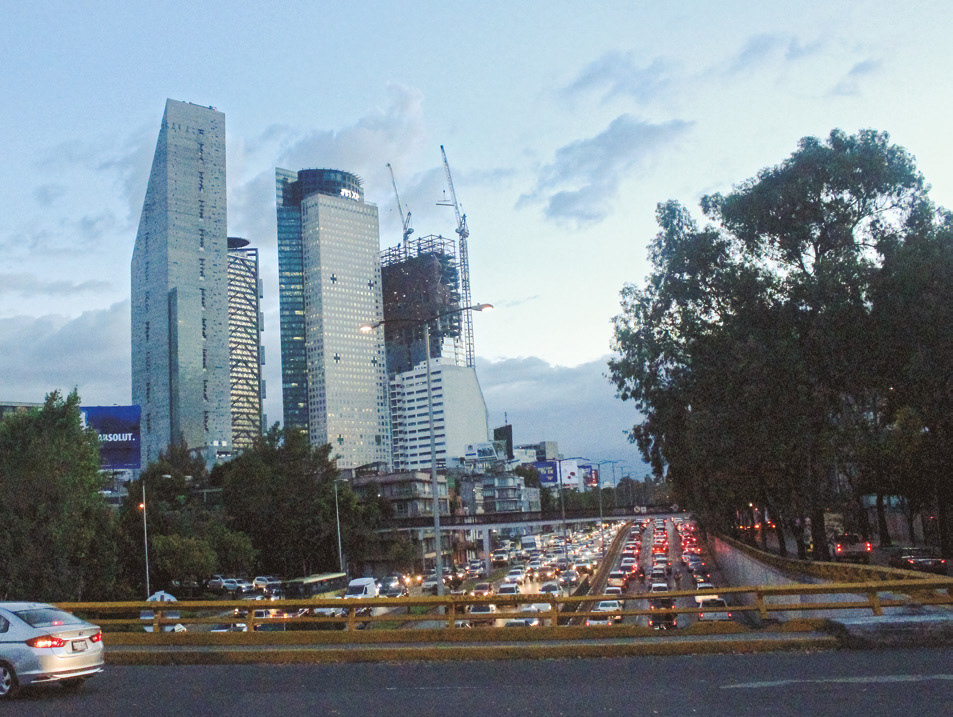
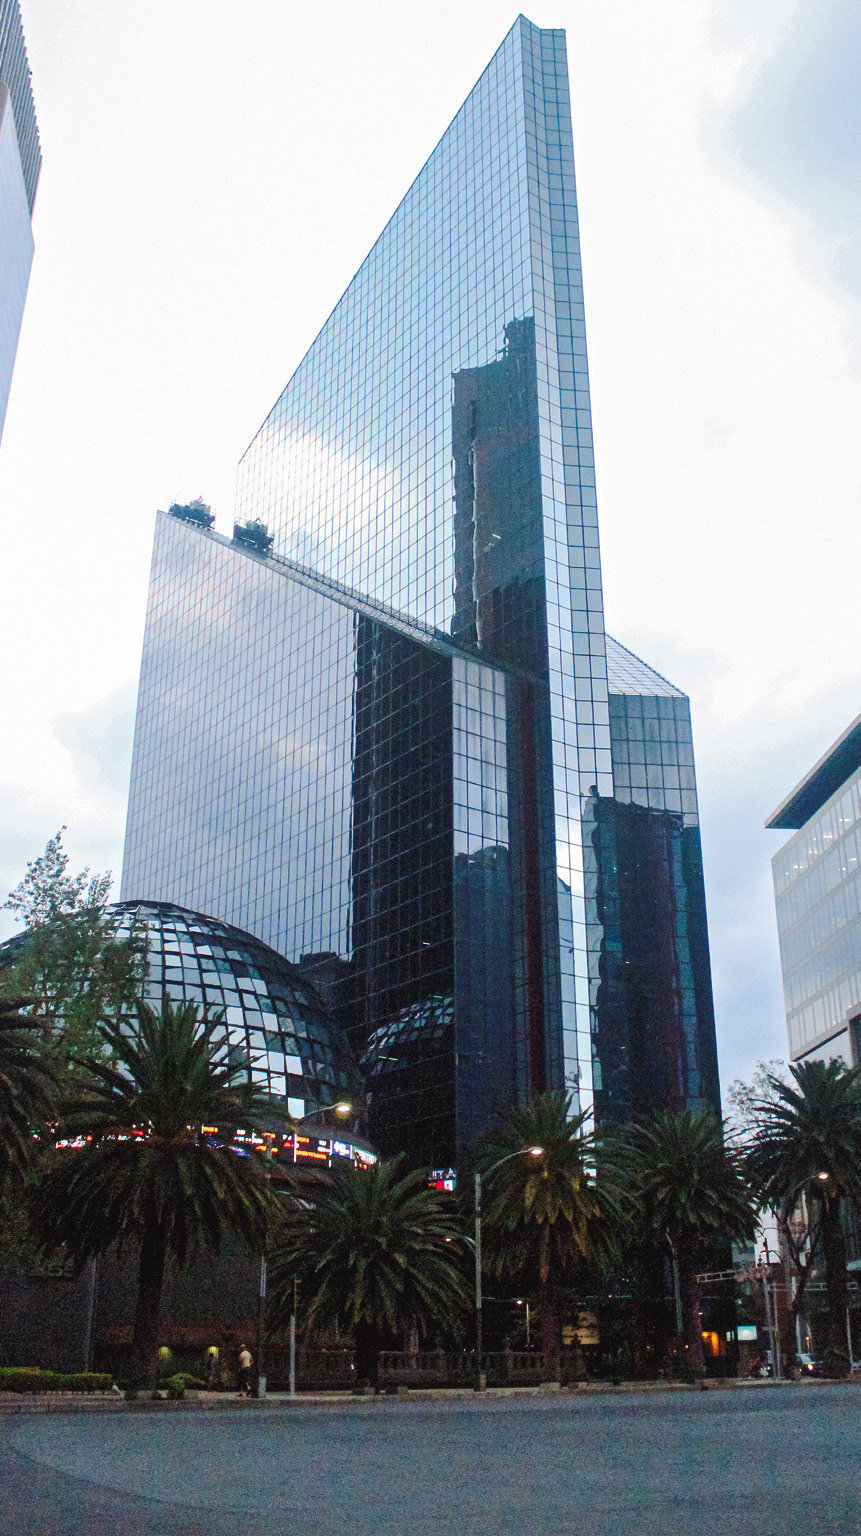
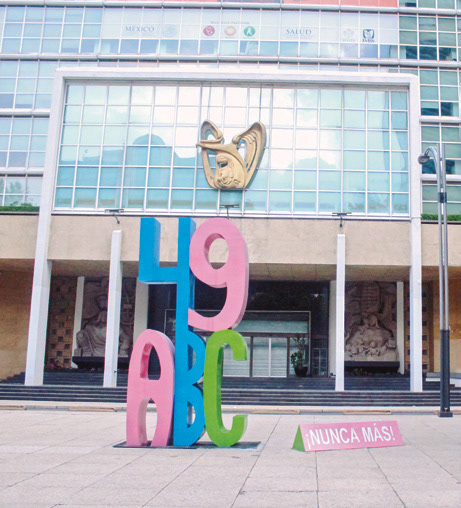
Some of the photographs around these publications were taken by me and the Infrastructure team. Personally, I used a 50D or T5 Canon camera for the pictures I took. Here are the most representative photographs I took for the publications.
The opening photographies were picked to give a glimpse of the chapter's subject. For instance, in "State of the Industry", the Latino Tower's image represents a general overview of the Infrastructure industry and the importance of business as one of the main buildings in Mexico City.
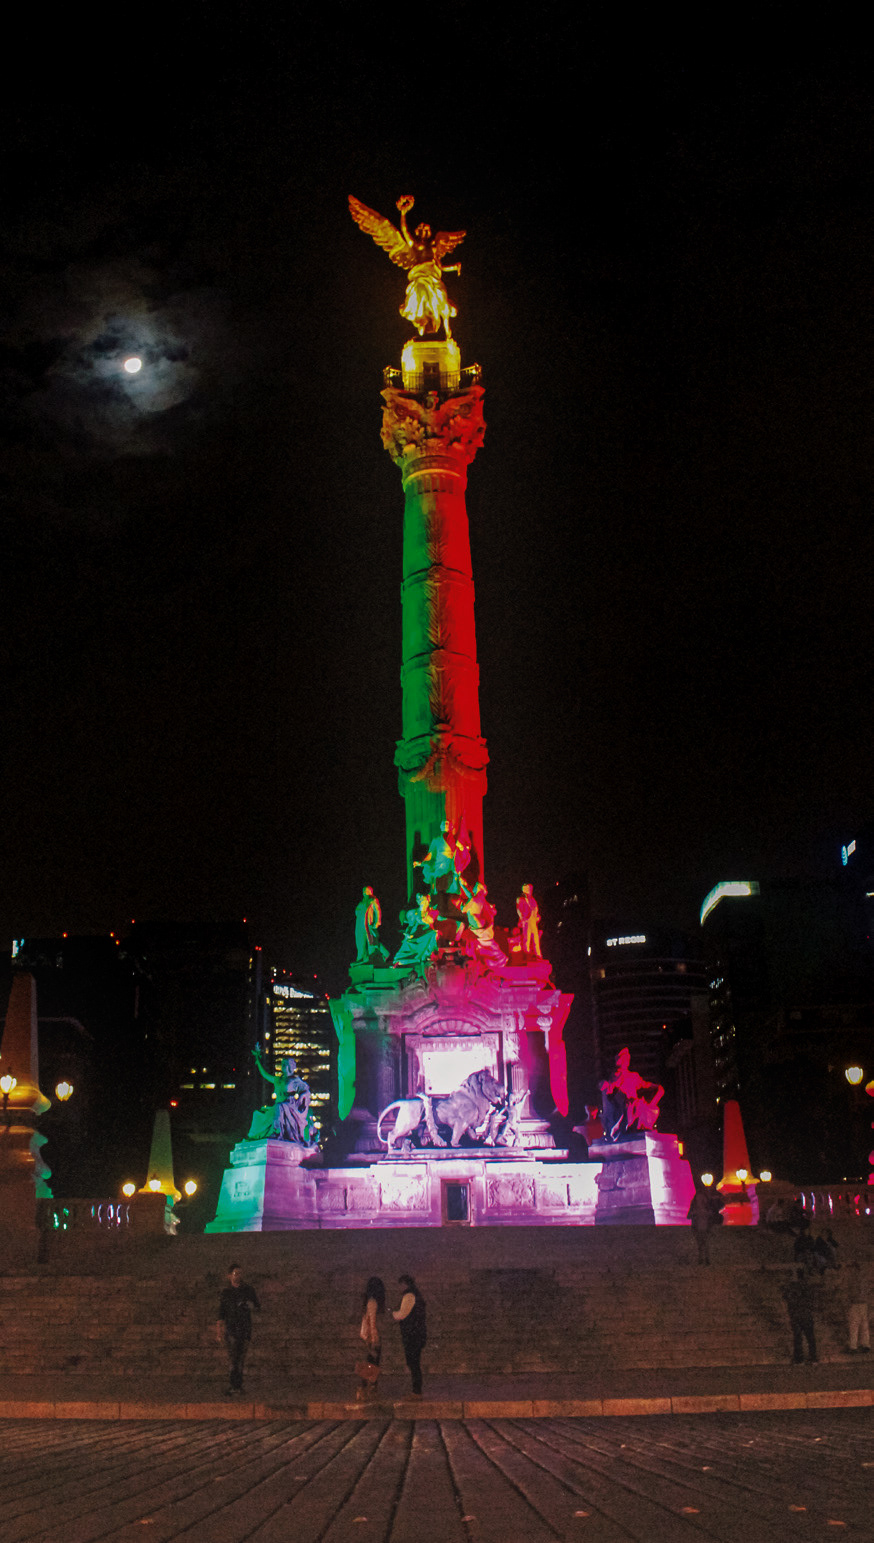
In chapter two, the Mexican overground represents Urban planning & mobility. I took this photograph around eight pm in front of the Monument of Revolution in Mexico City.

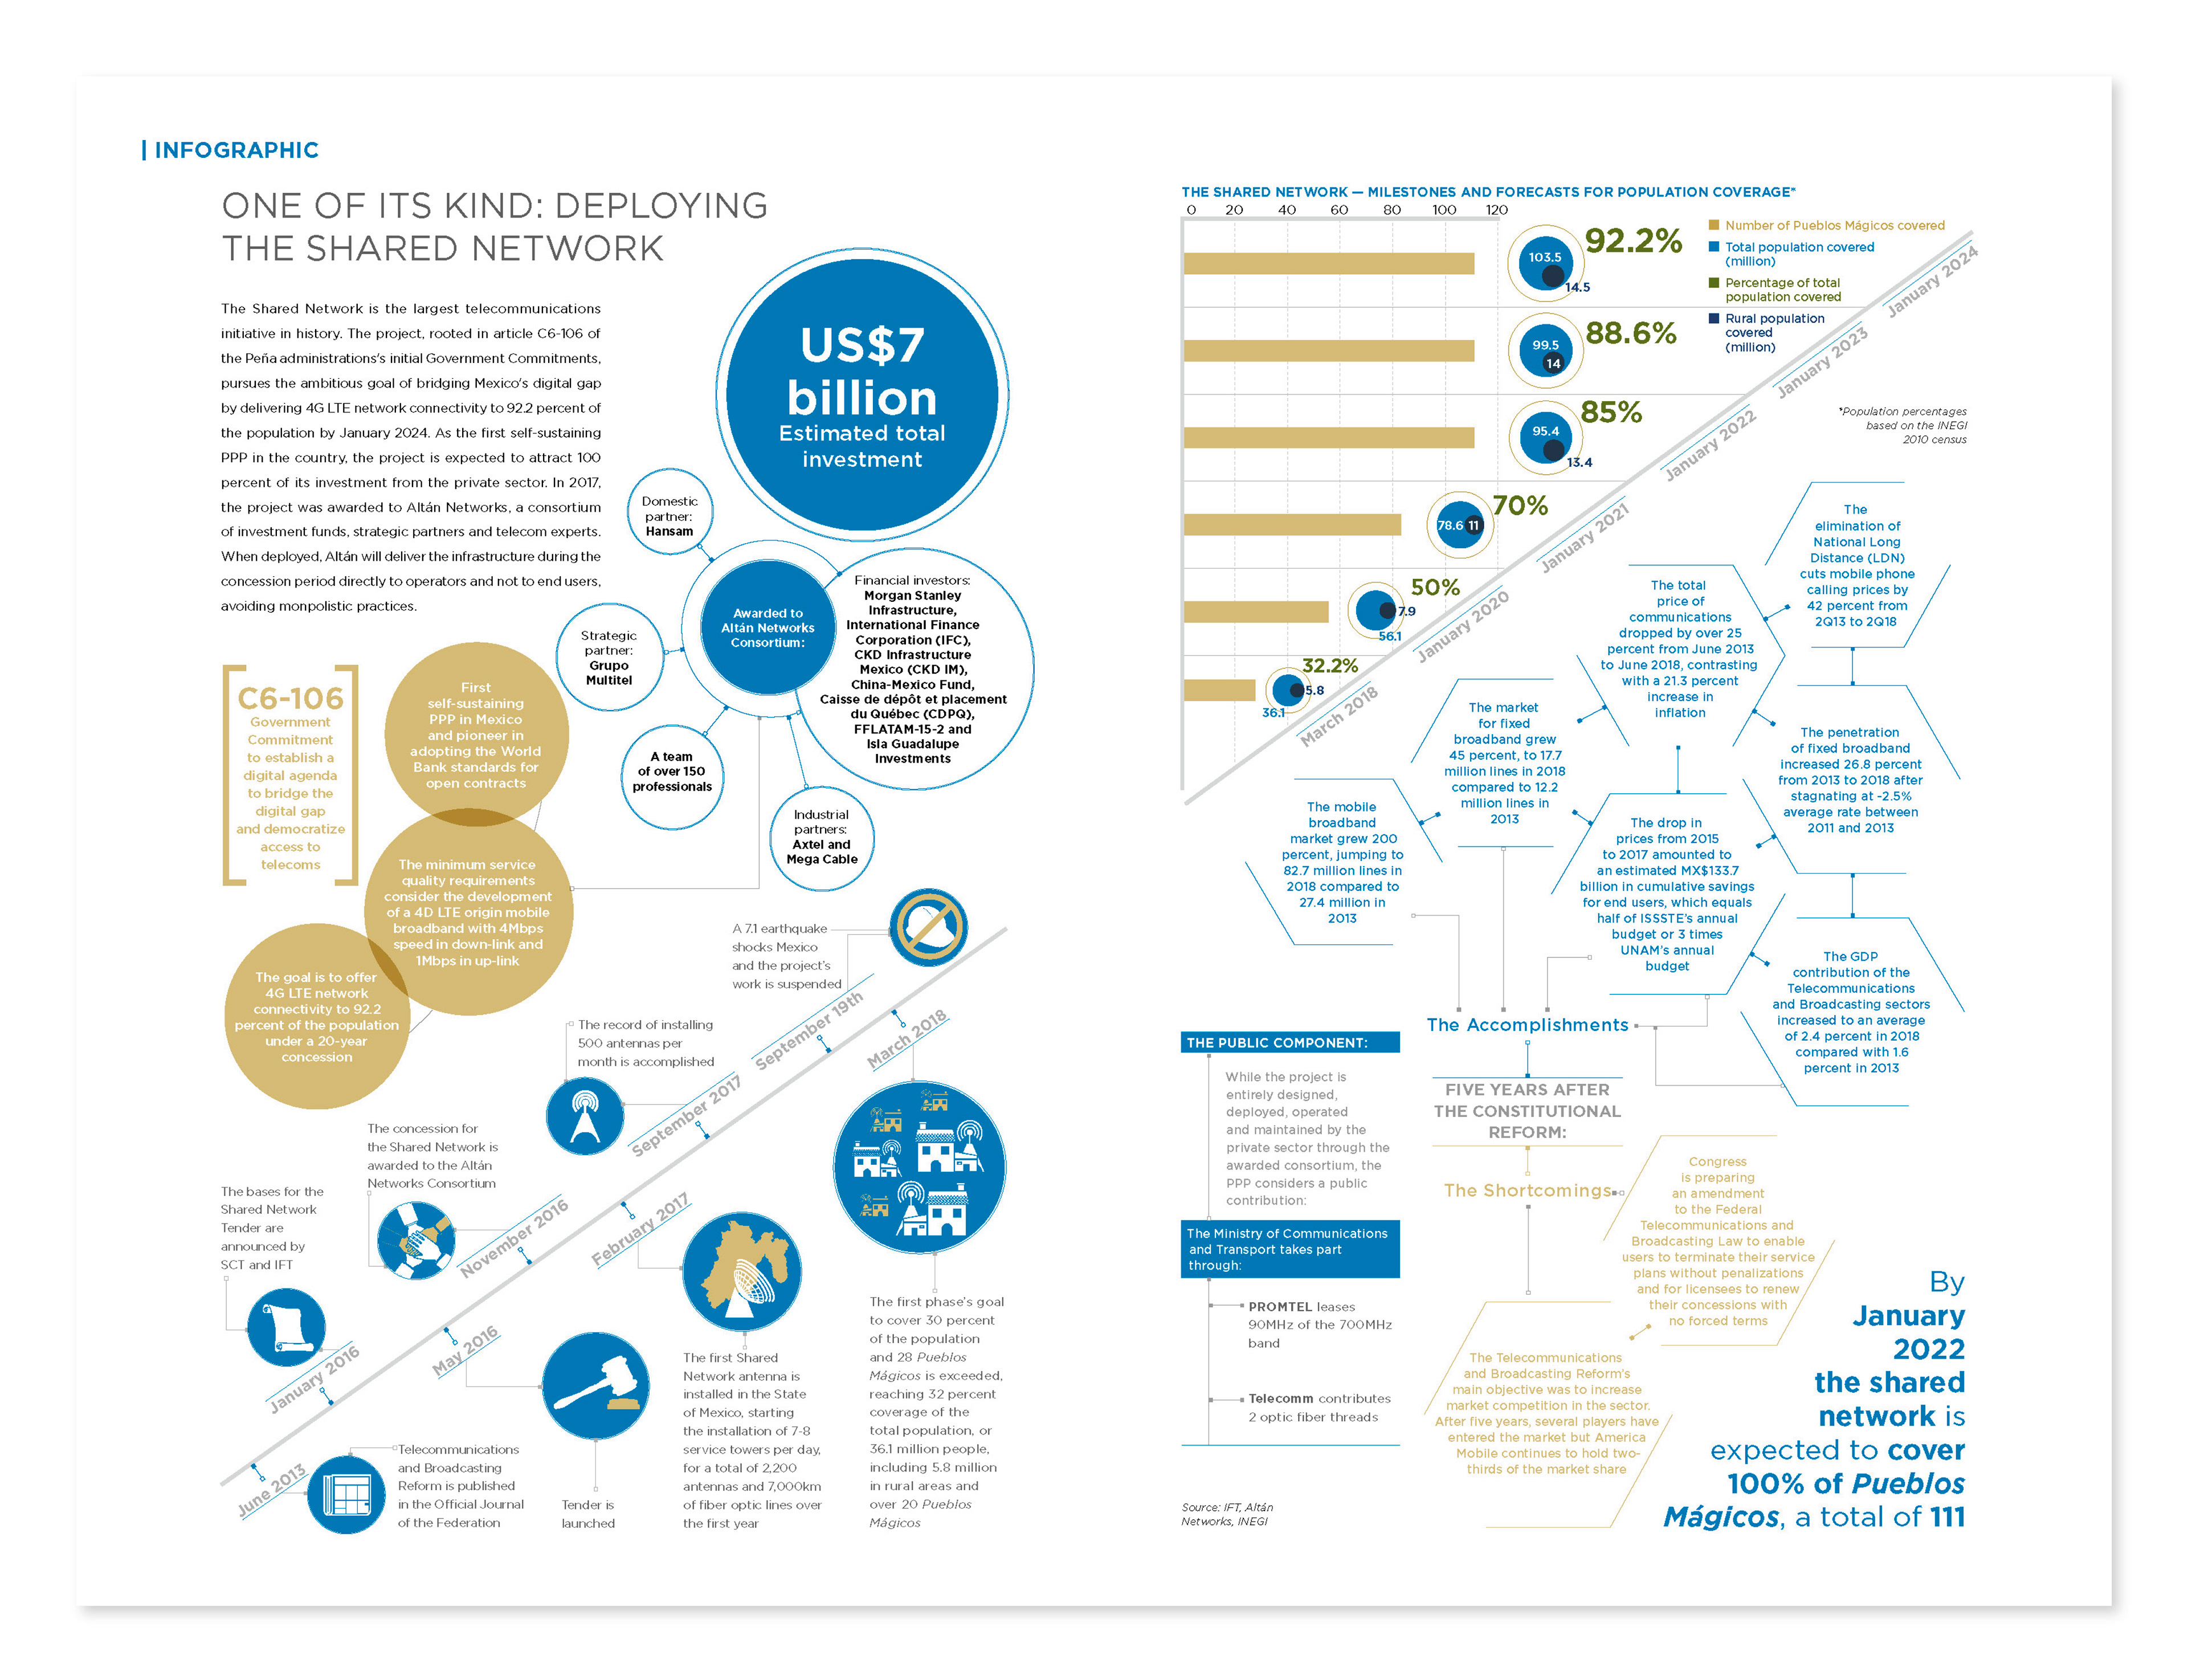
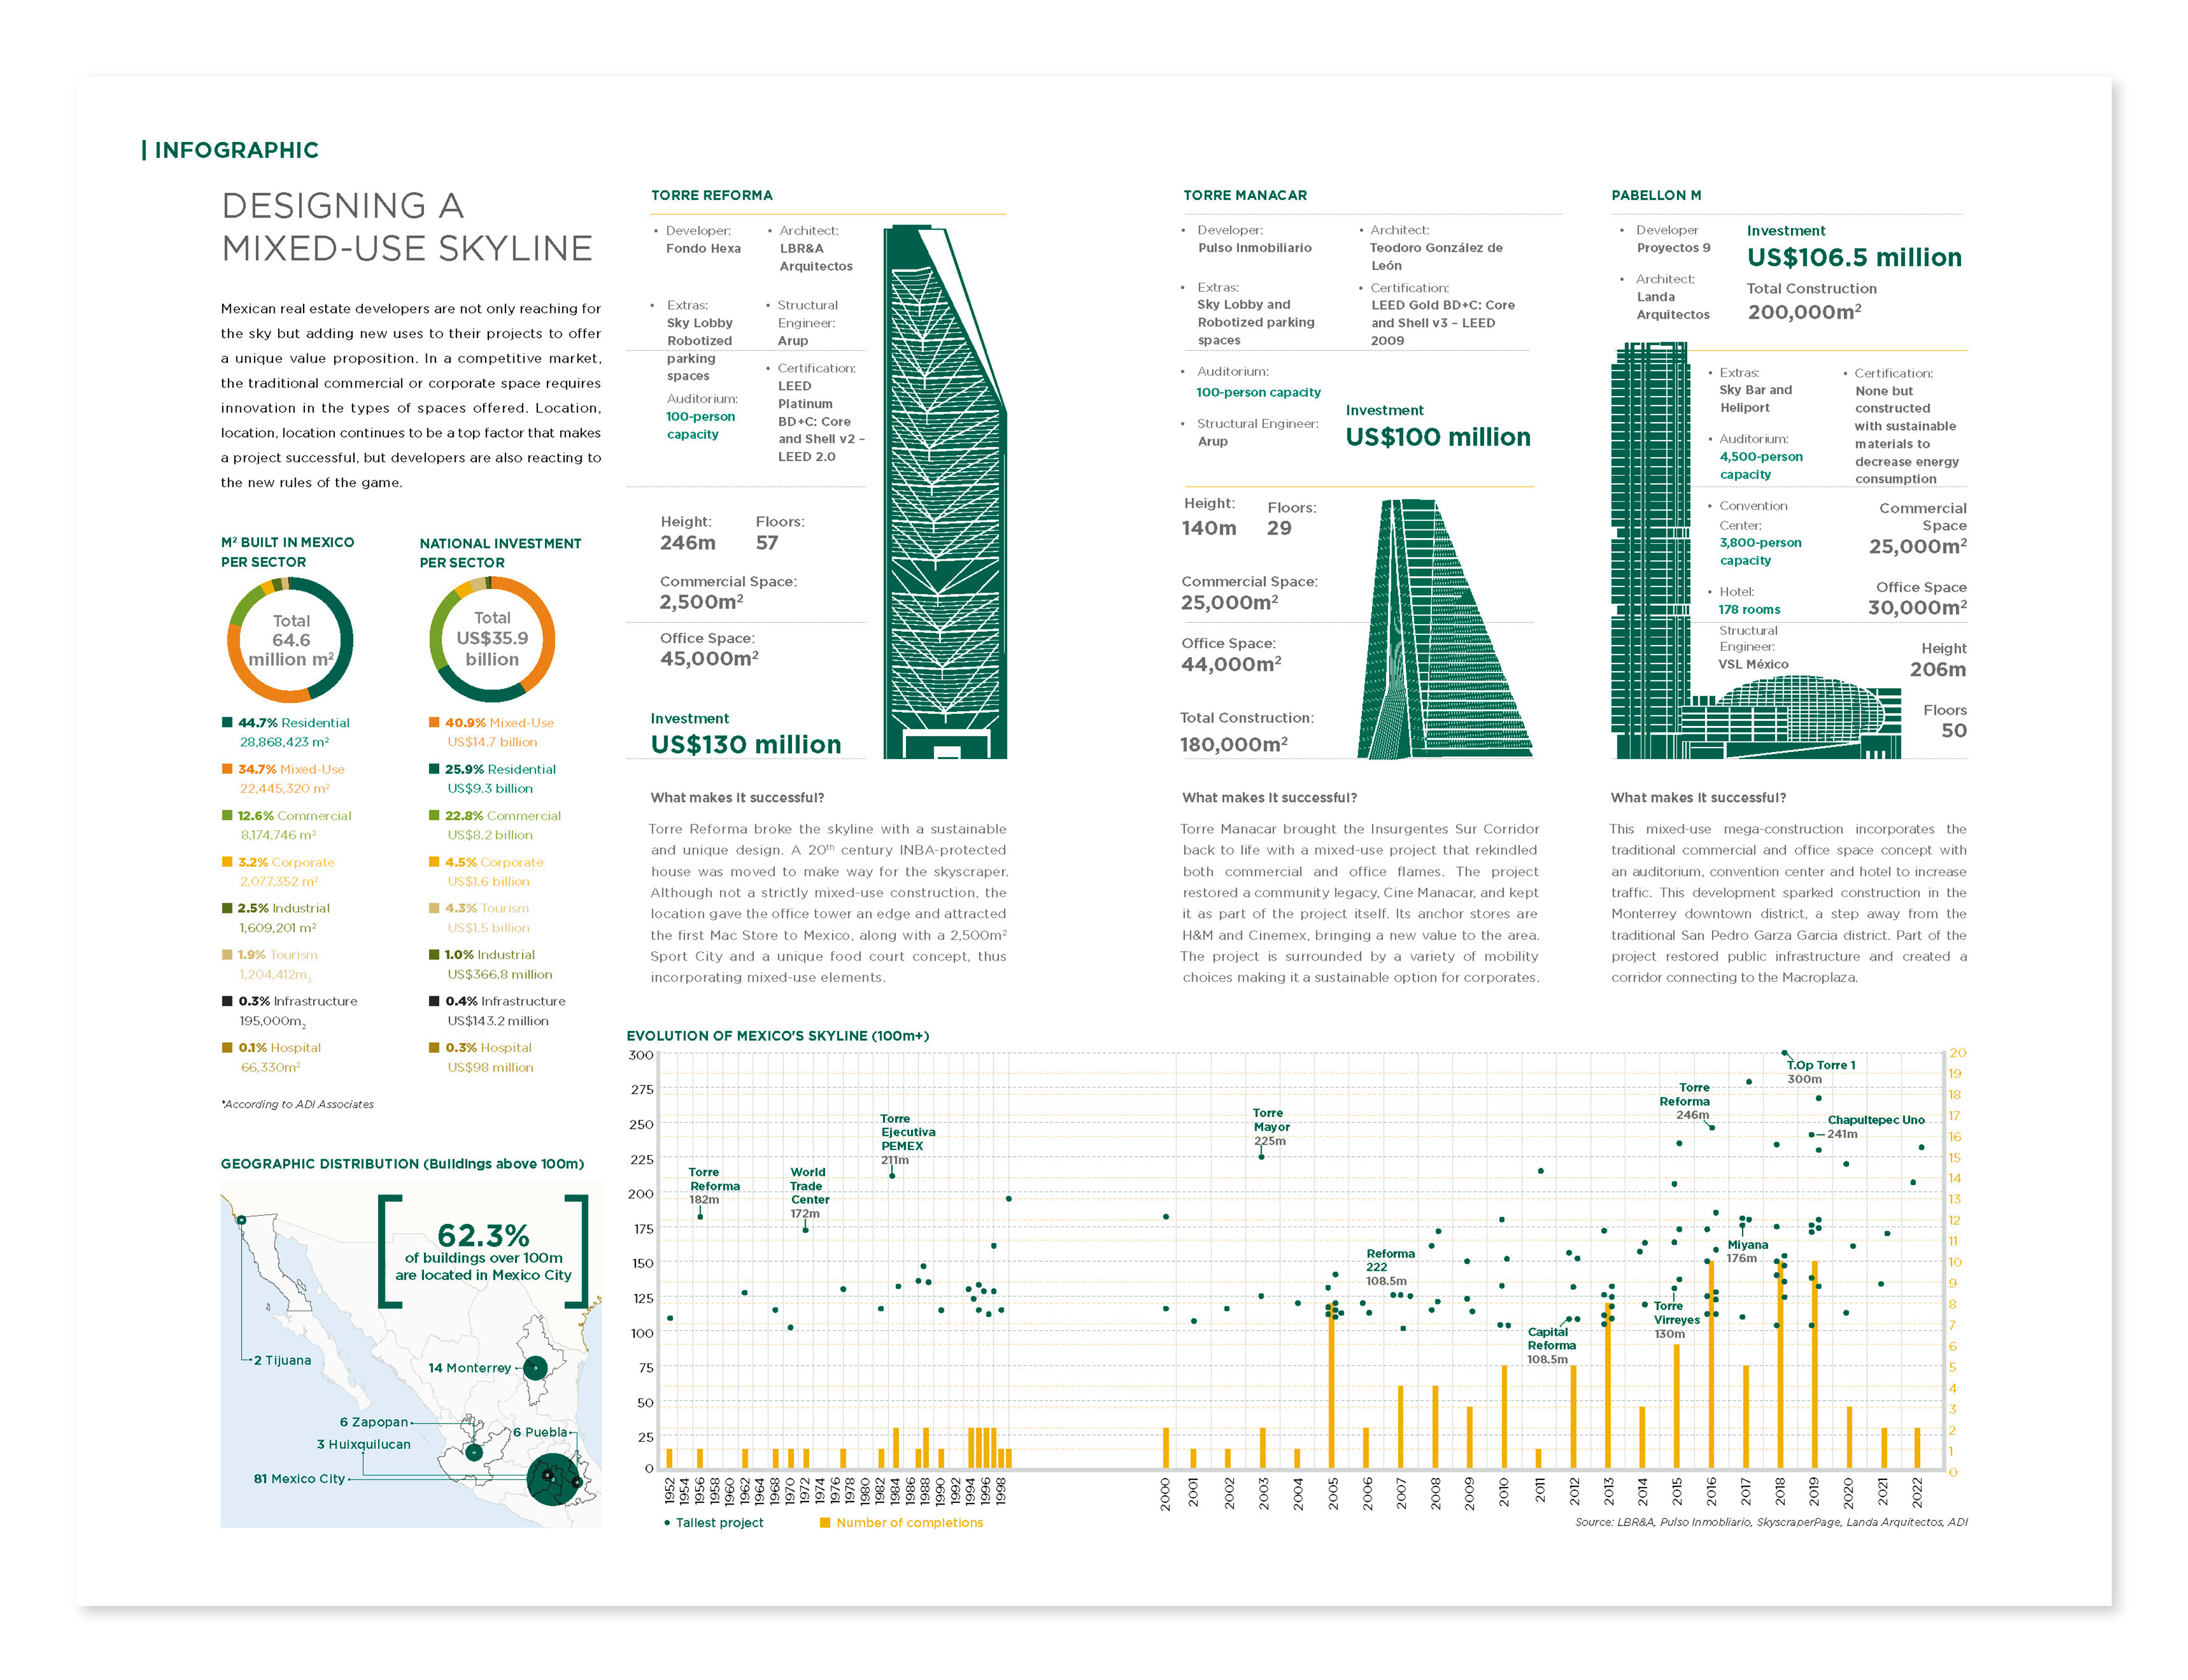
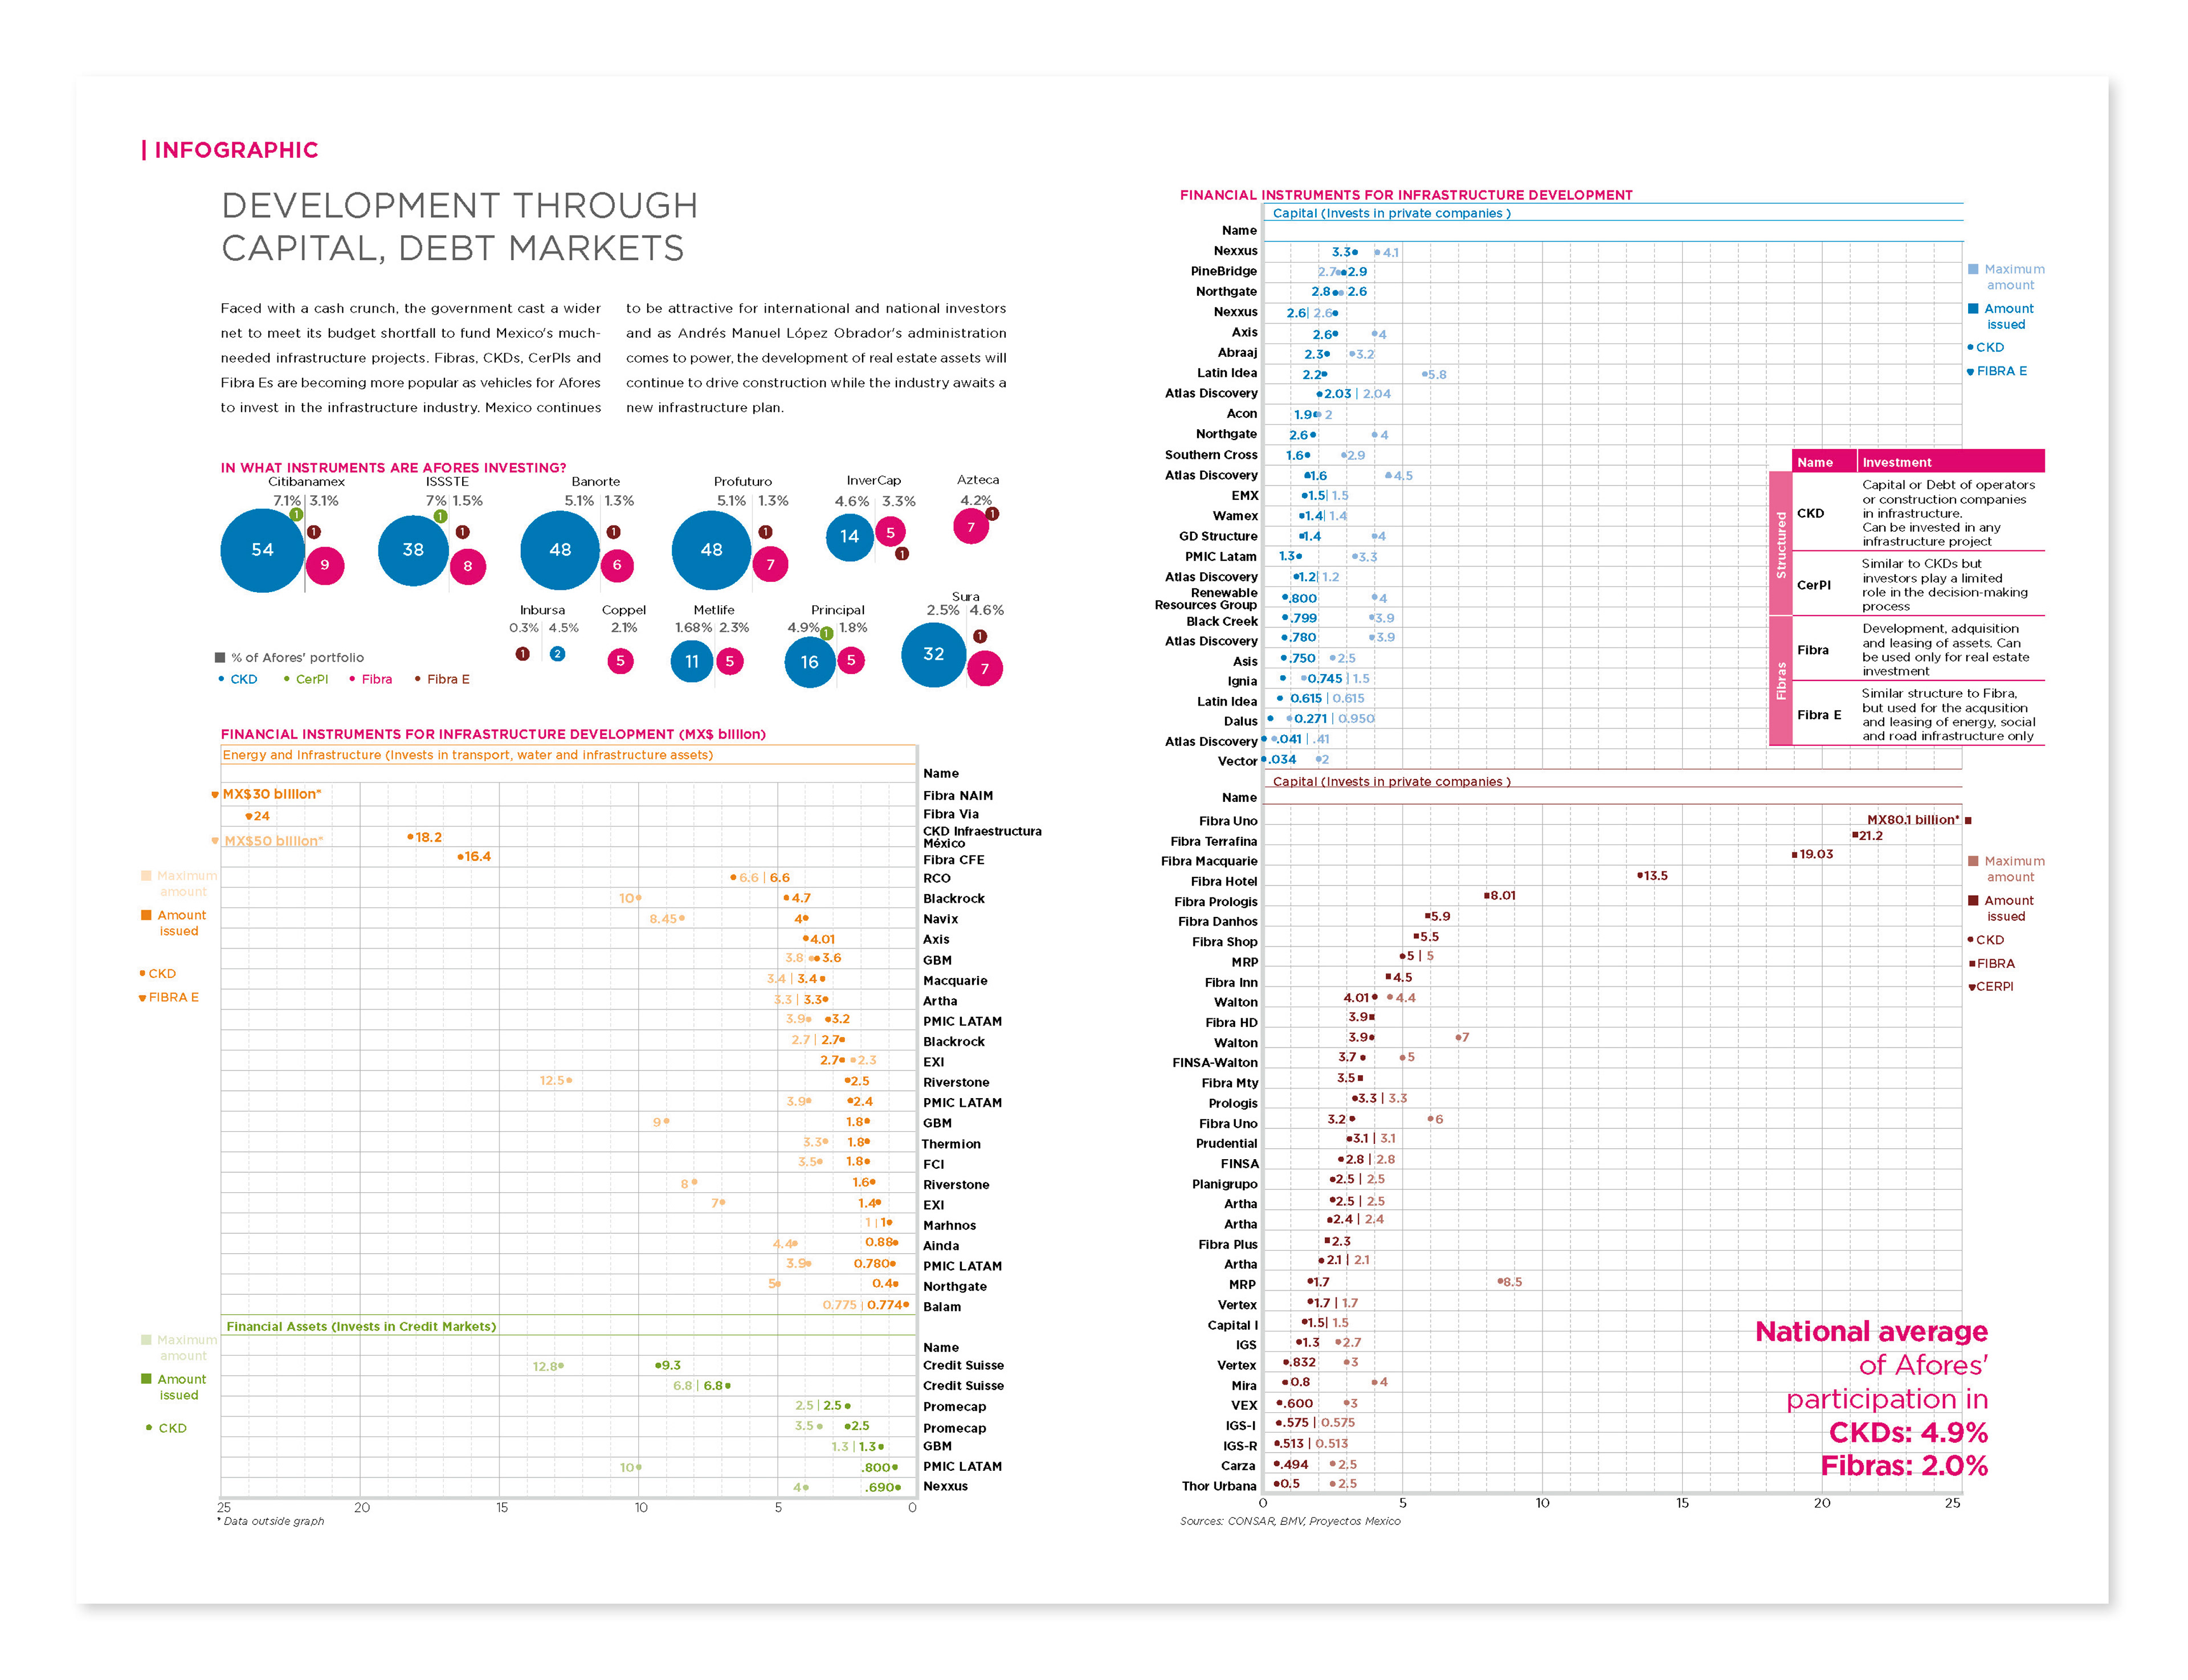
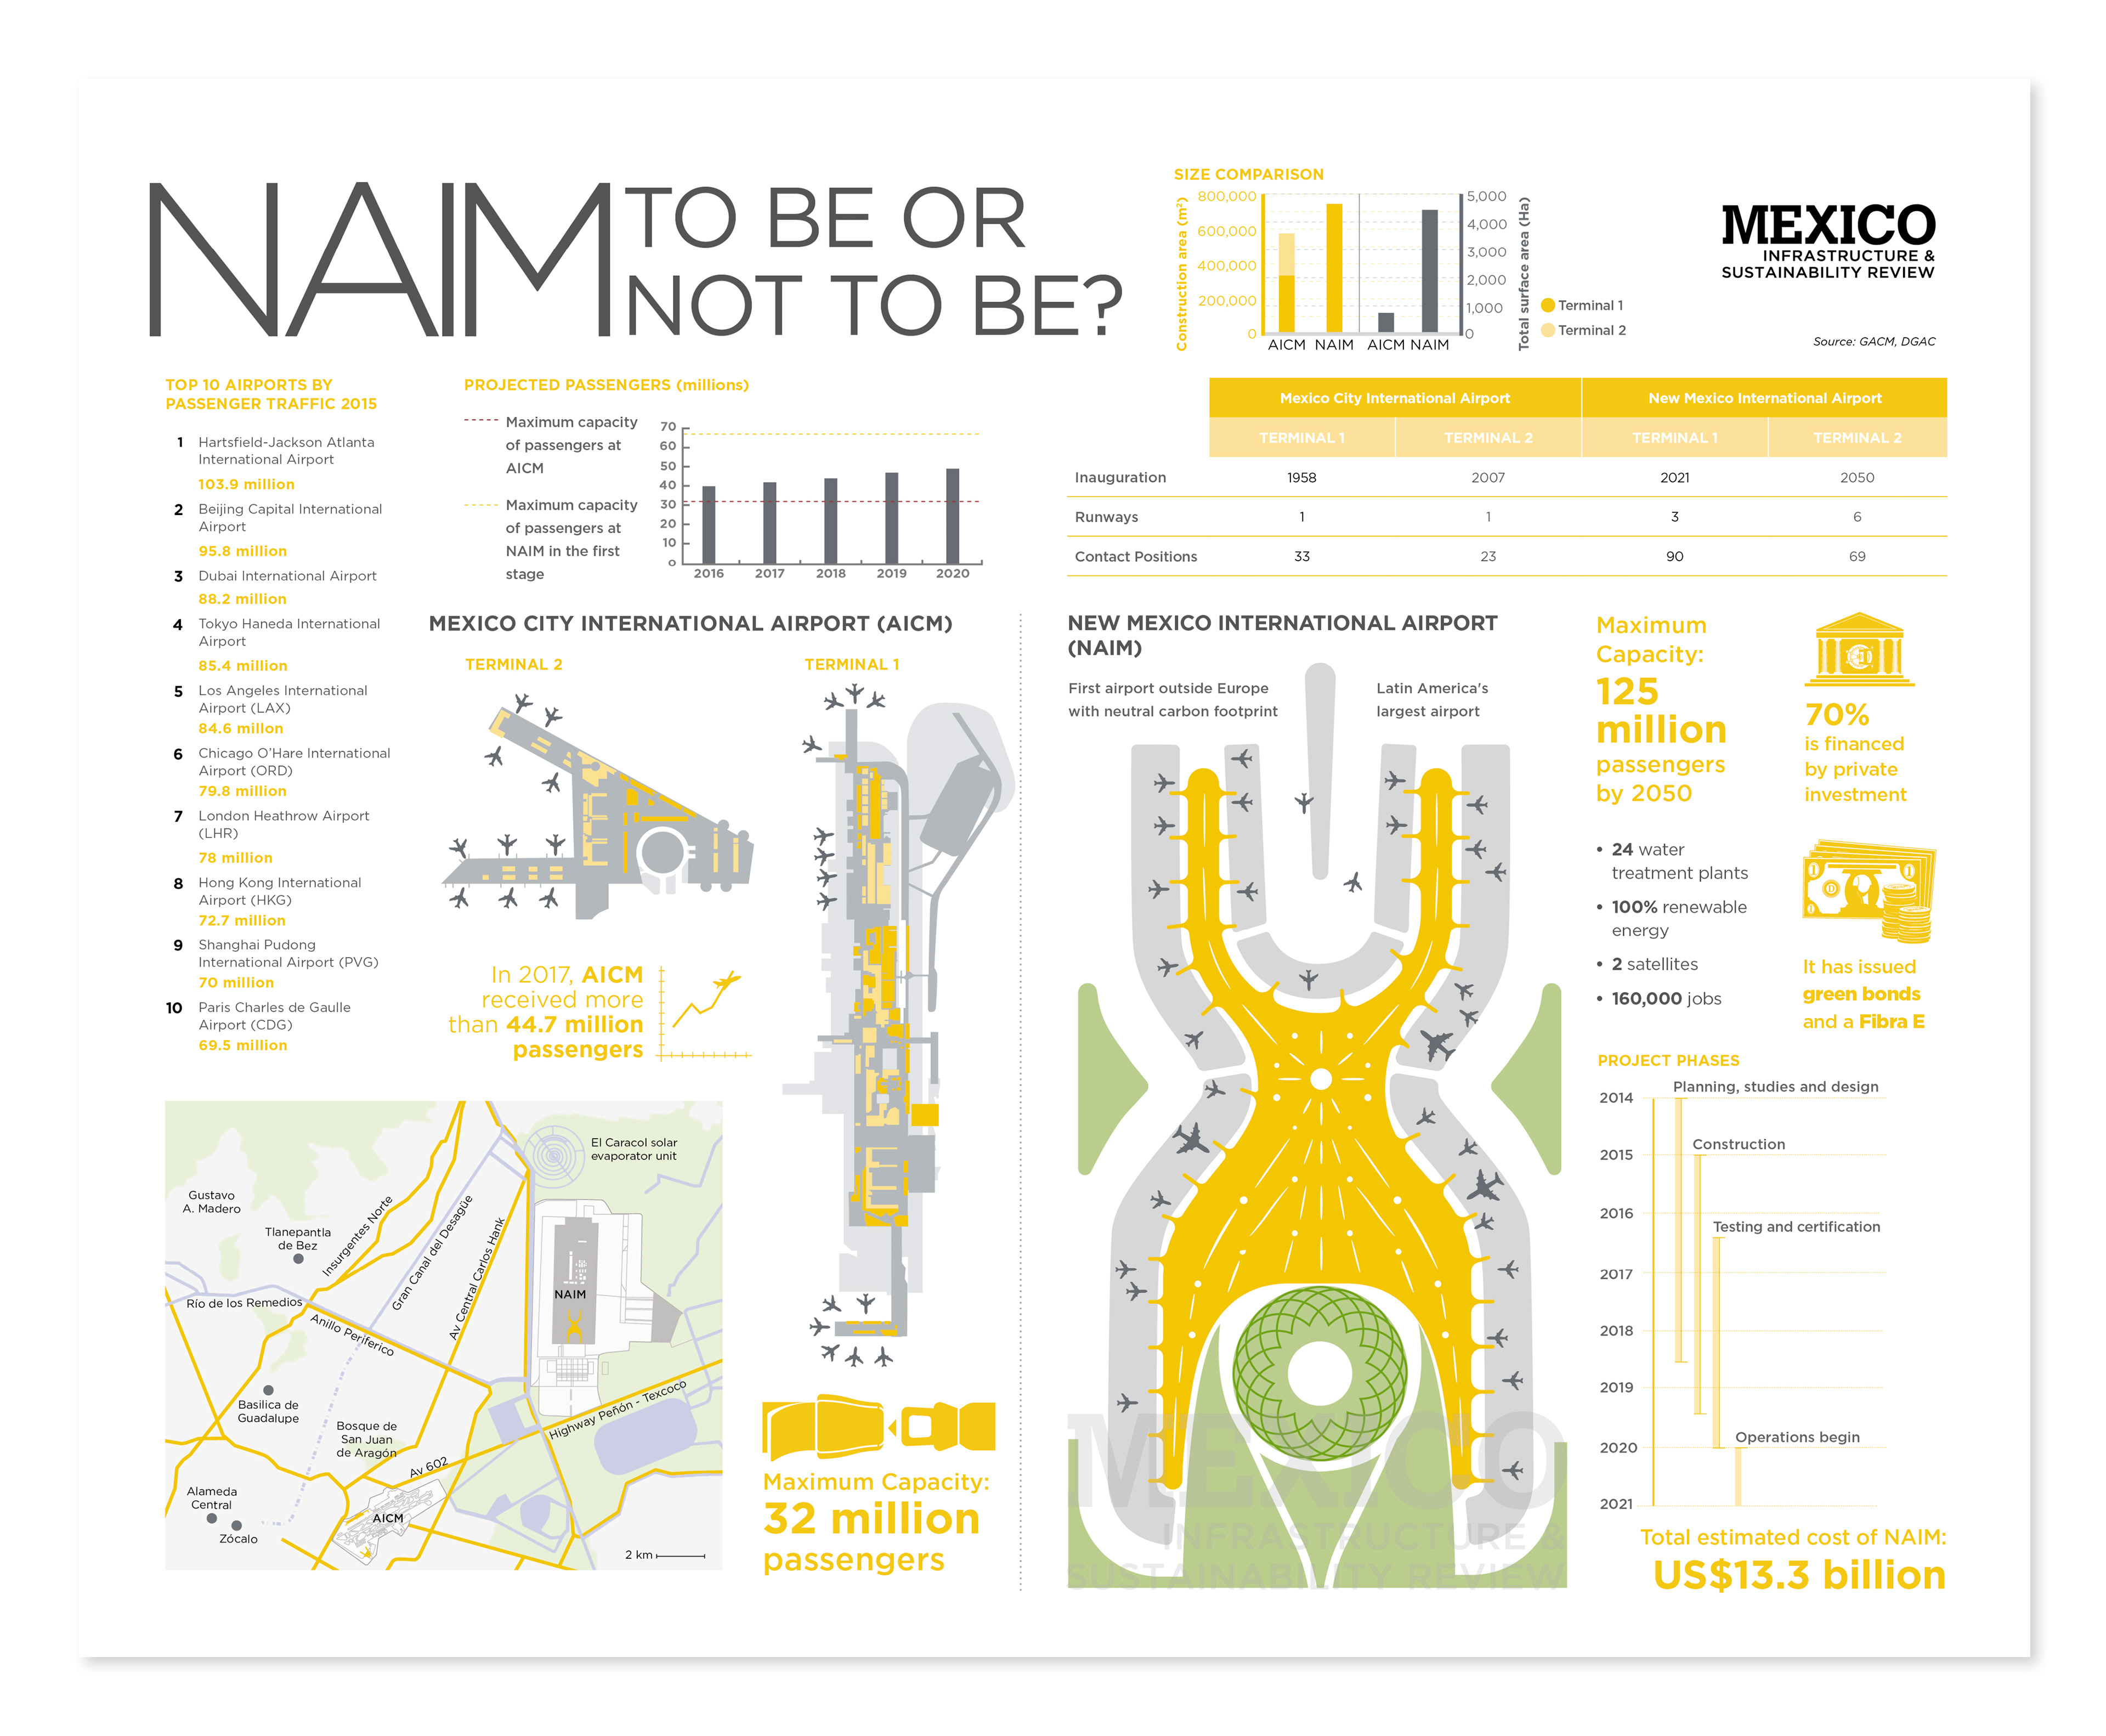
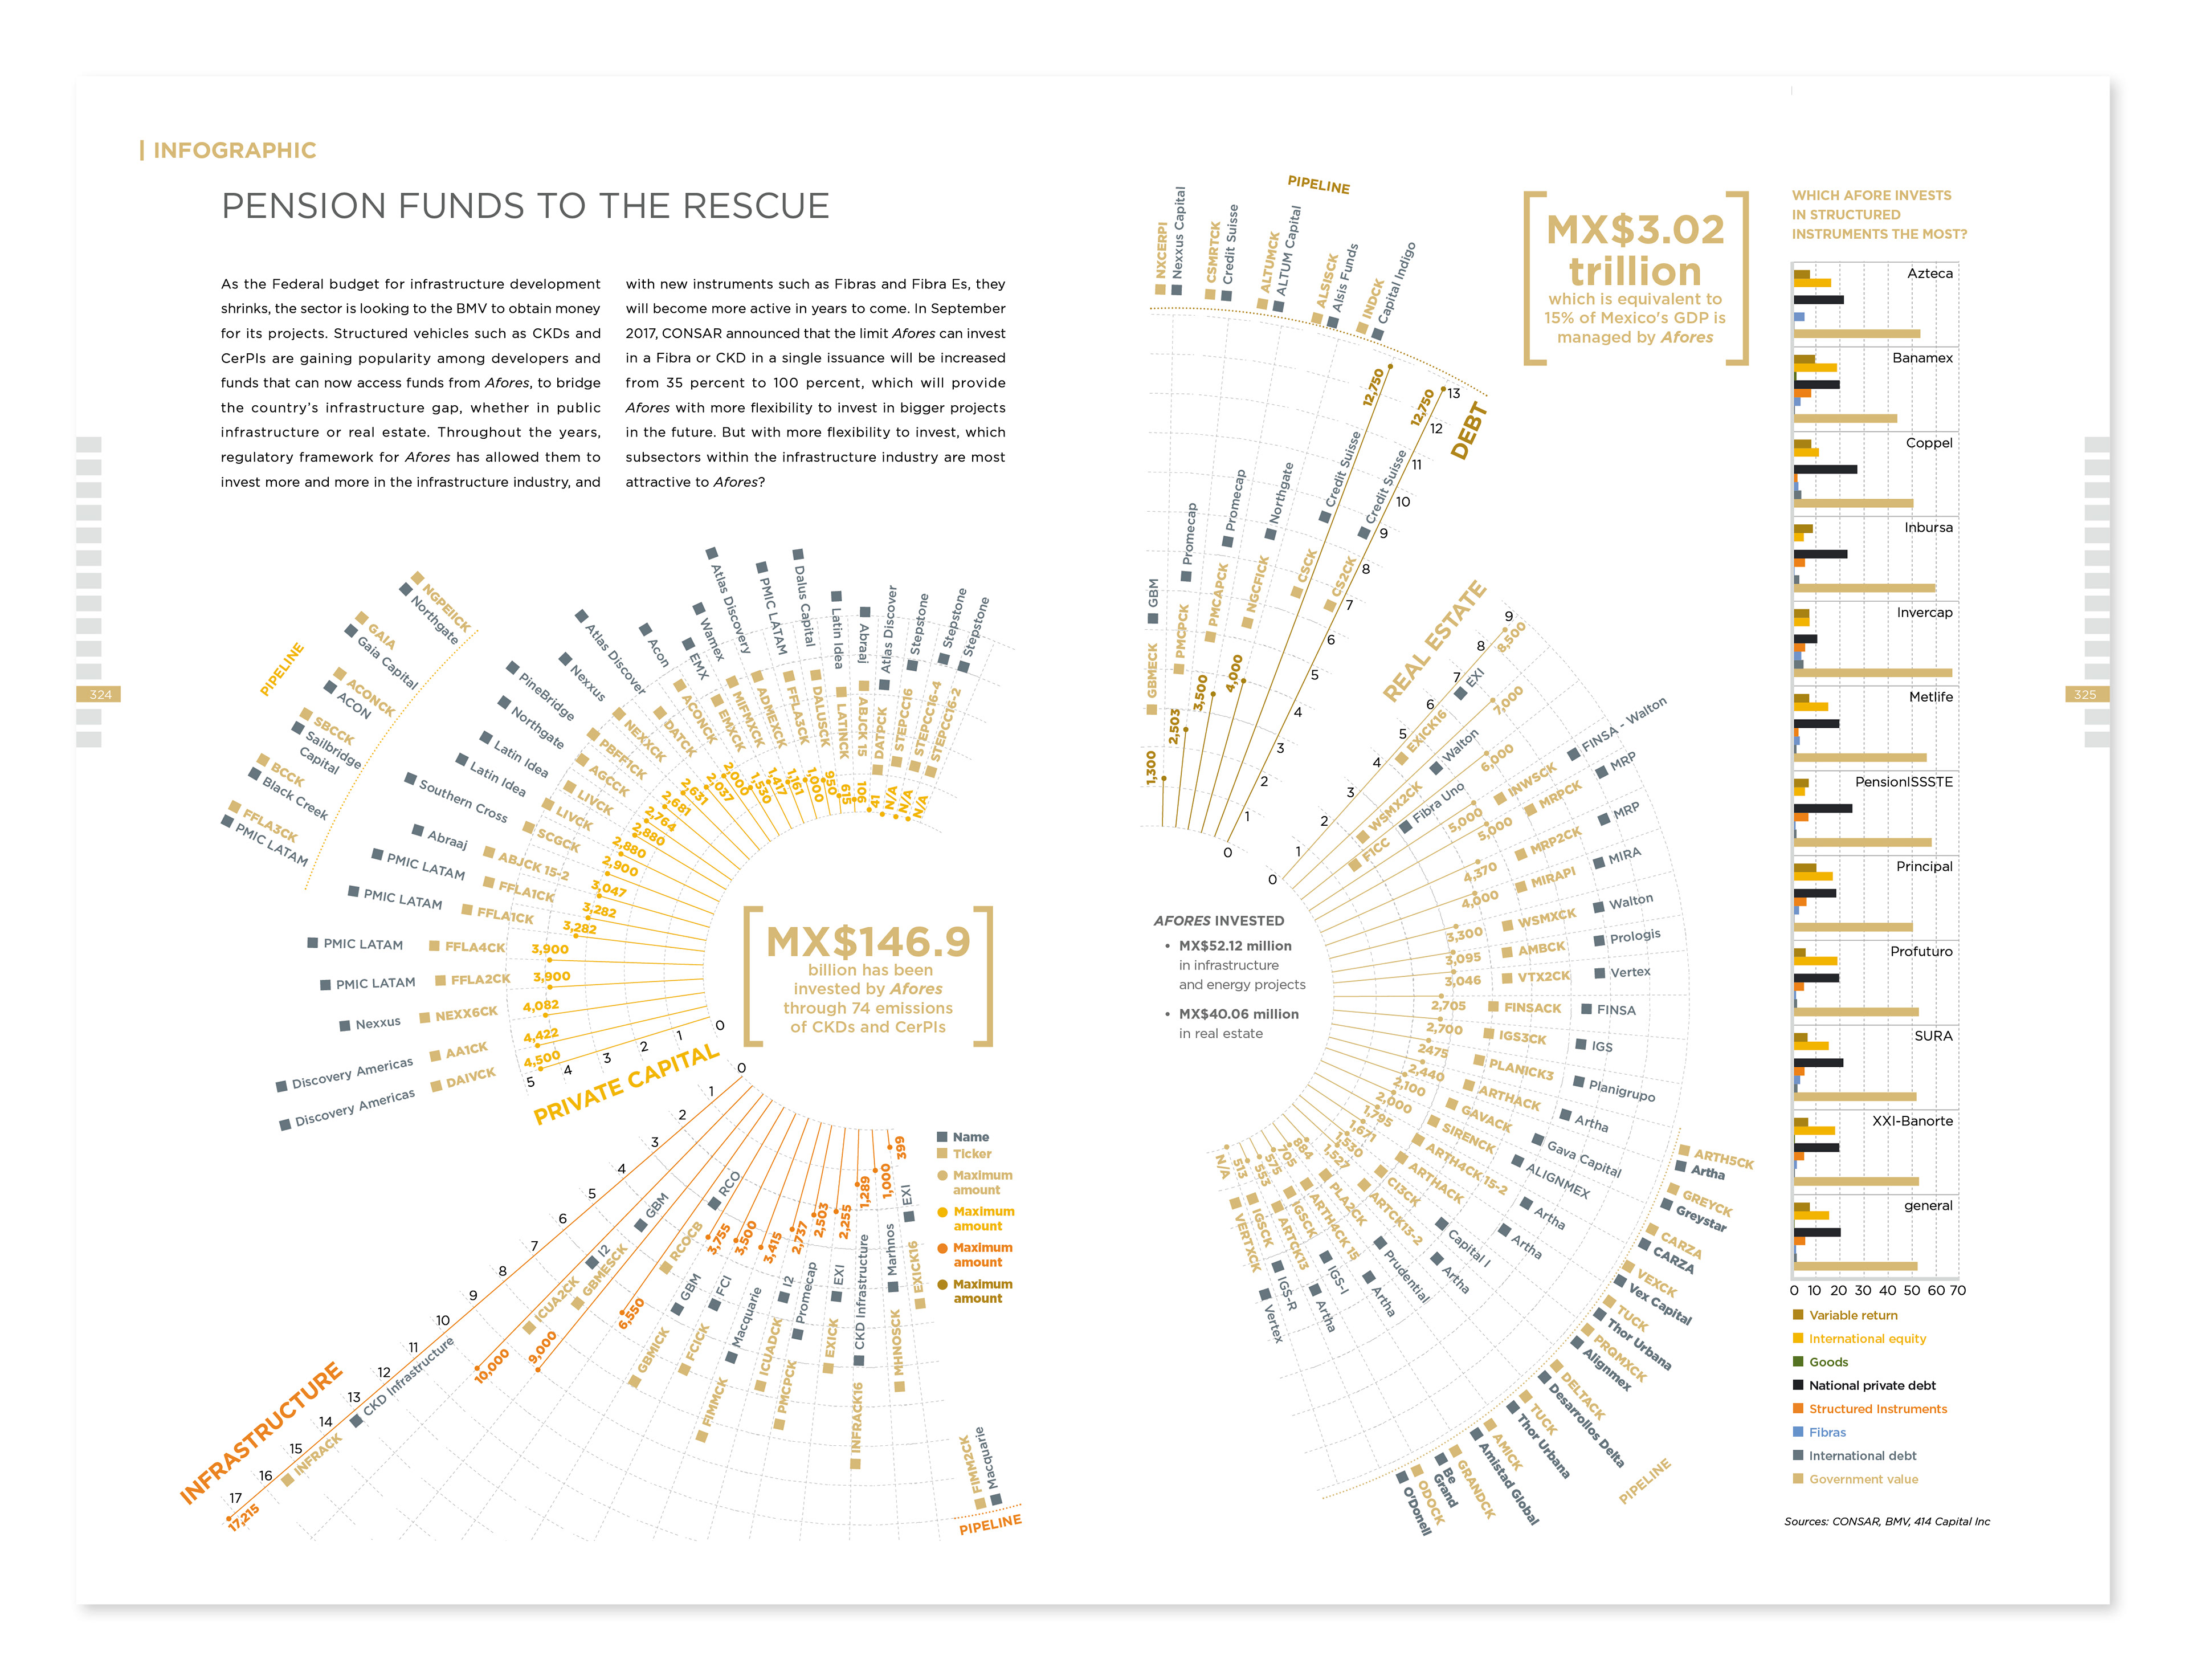
Infographics & Data Visualisation:
The infographics or data Visualisations were always data-oriented, with a message and content clear to its subject and reader; though-out for businessmen, CEO or manager. A broader explanation of each visualisation is found by clicking any of the images below.
Infographics 2016
Infographics 2017/18


Infographics 2019